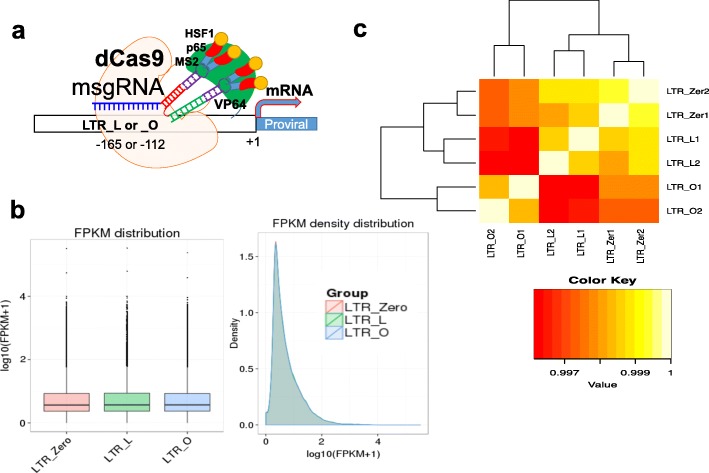
Fig. 1.
No difference in the entire RNA transcripts among the three experimental conditions. a Diagram showing the HIV proviral activation by the dCas9-SAM system with msgRNAs targeting LTR_L or LTR_O. b Box plot and density plot for the distribution of transcript expression levels measured by FPKM (averaged within replicates) of the three conditions. The plotted region of the box plot represents the maximum, upper quartile, median, lower quartile, and minimum, respectively, from top to bottom. c Hierarchical clustering of samples based on Pearson correlation coefficient of transcript expression levels for all the pairwise comparisons of the samples

