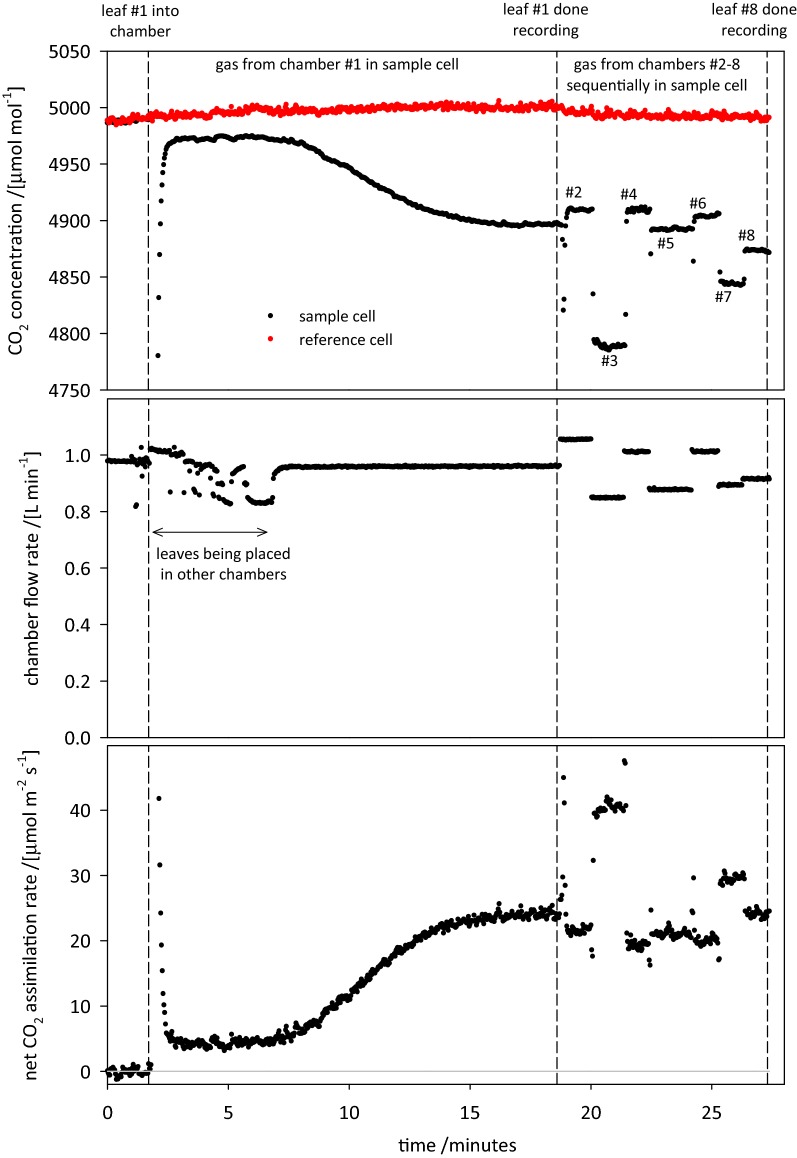
Fig. 3.
Sample OCTOflux measurement cycle. A leaf is placed in chamber #1 at the time indicated by the first dashed line; leaves are placed in the other seven chambers for the next several minutes (as evidenced by fluctuations in chamber flow rate (b). After around 16 min, the assimilation rate for leaf #1 has stabilized (second dashed line), and the solenoid valves are adjusted to direct sample gas from chamber #2 through the IRGA sample cell. This is repeated over the next 7 min for the remaining chambers. The cycle is complete when the 8th leaf is done recording

