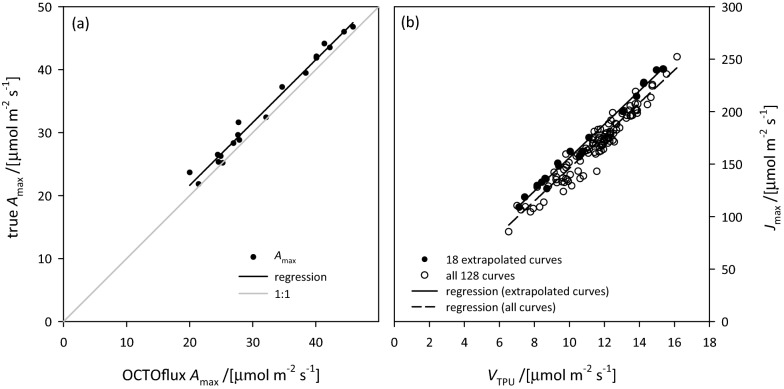
Fig. 6.
Relationships between a true Amax (value under electron transport limited conditions) and OCTOflux Amax (value at high CO2 under TPU-limited conditions, estimated by extrapolating to high ci the Busch et al. [12] model for TPU-limited A fitted to A versus ci curve data for 18 A versus ci curves for which data were adequate for this purpose), and b VTPU and Jmax estimated from A versus ci curves for the 18 curves indicated in a (solid symbols) and for all 128 A versus ci curves measured (open symbols). In both a and b, regressions for the 18 curves are shown with solid lines (a: y = 0.9968x + 1.7064, r2 = 0.9841; b: y = 0.0622x + 0.298, r2 = 0.9911); in b, a regression for the open symbols is shown with a dashed line (y = 0.0597x + 1.3857, r2 = 0.9301)

