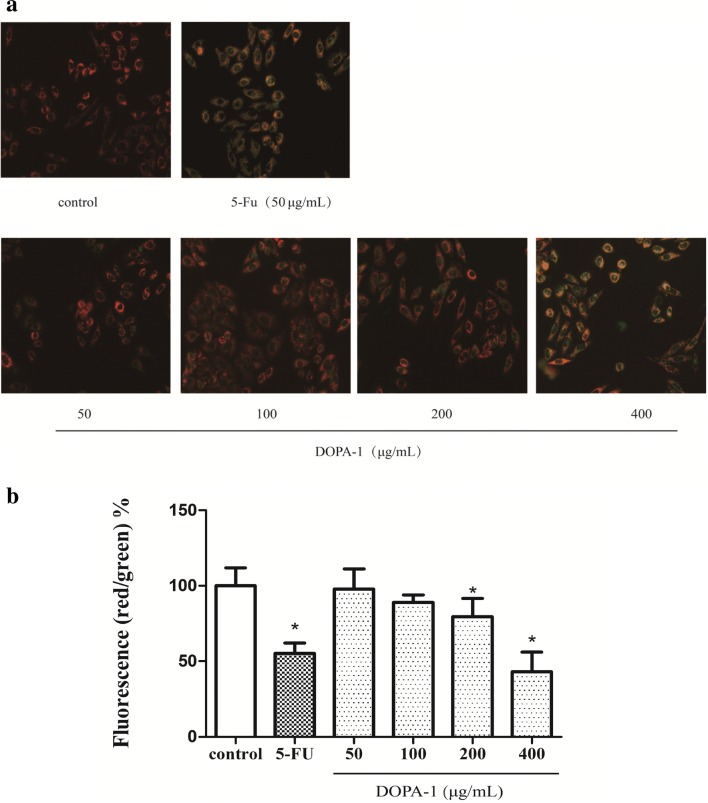
Fig. 7.
Treatment with DOPA-1 alters mitochondrial function in HepG-2 cells. a Fluorescence micrographs of HepG-2 cells stained with JC-1. Changes in cell morphology were observed under ×200 magnification. b Quantitative analysis of MMP in HepG-2 cells. Data are expressed as the fluorescence ratio of red to green and are presented as the mean ± SD of three independent experiments. *p < 0.05, compared to the control

