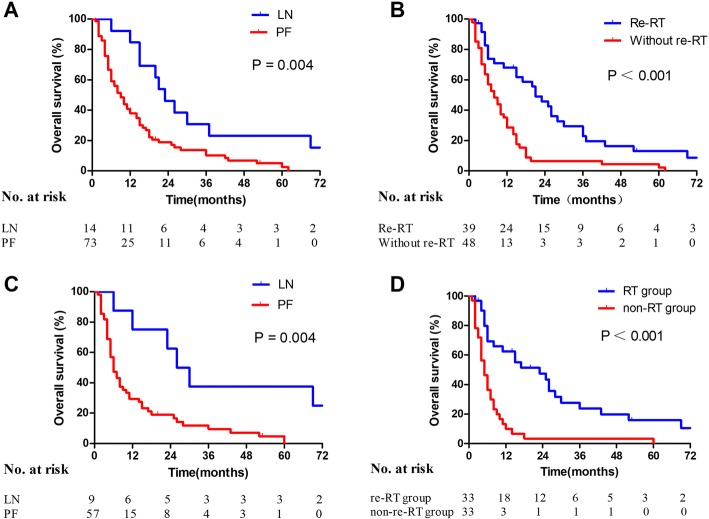
Fig. 2.
Kaplan–Meier analysis of OS according to (a) failure pattern (LN vs. PF, P = 0.004) before matching; (b) re-irradiation (re-RT vs. without re-RT, P < 0.001) before matching; (c) failure pattern (LN vs. PF, P = 0.004) after matching; and (d) re-irradiation (re-RT group vs. non-re-RT group, P < 0.001) after matching

