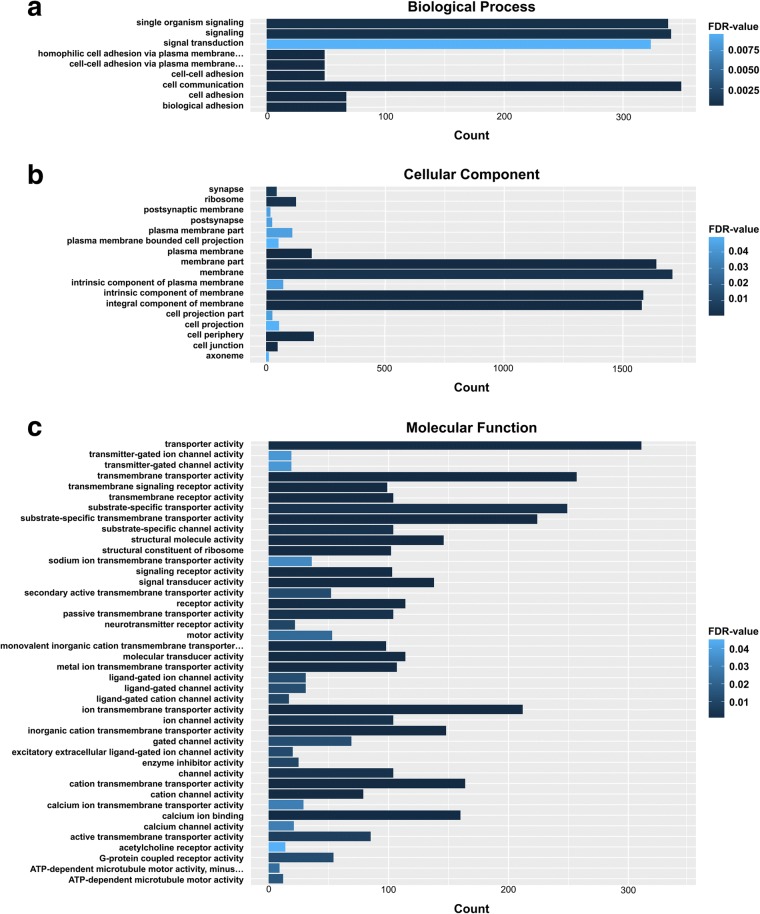
Fig. 3.
GO analysis of DE transcripts in S. mekongi male and female worms. GO categories are organized according to three main ontologies: biological process (a), cellular component (b) and molecular function (c). The x-axis shows the numbers of transcripts. The y-axis shows the GO term. GO terms with higher FDR values are shown in light blue, whereas GO terms with lower FDR values are shown in dark blue

