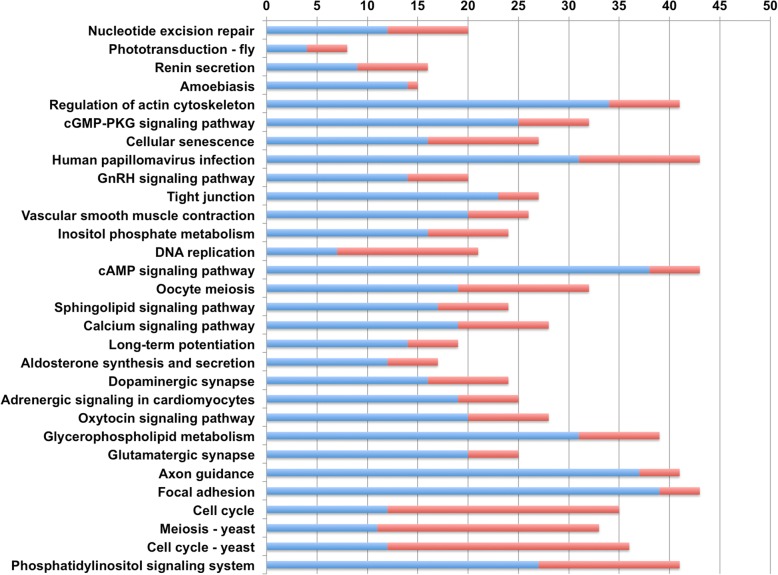
Fig. 5.
Top 30 most significantly enriched pathways in S. mekongi male and female worms. The bar graph shows the number of annotated DE transcripts (x-axis) with each significantly enriched pathway (y-axis). Blue and red colors are the numbers of upregulated transcripts in male and female worms, respectively

