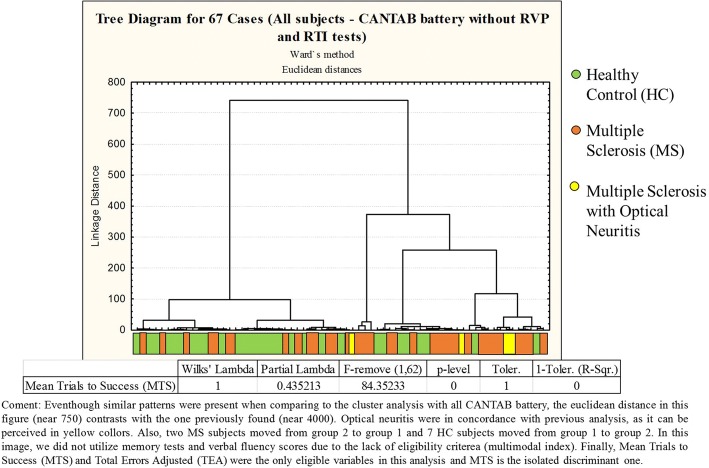
Fig. 4.
Dendrograms from a cluster analysis of healthy control subjects and multiple sclerosis patients based on their performance on selected CANTAB tests without Rapid Visual Processing (RVP) and Reaction Time (RTI) scores. Even though similar patterns were present when comparing to the cluster analysis with all CANTAB battery, the Euclidean distance in this figure (near 750) contrasts with the one previously found (near 4000). Optical neuritis were in concordance with previous analysis, as it can be perceived in yellow colors. Also, two MS subjects moved from group 2 to group 1 and 7 HC subjects moved from group 1 to group 2. In this image, we did not utilize memory tests and verbal fluency scores due to the lack of eligibility criteria (multimodal index). Finally, Mean Trials to Success (MTS) and Total Errors Adjusted (TEA) were the only eligible variables in this analysis and MTS is the isolated discriminant one

