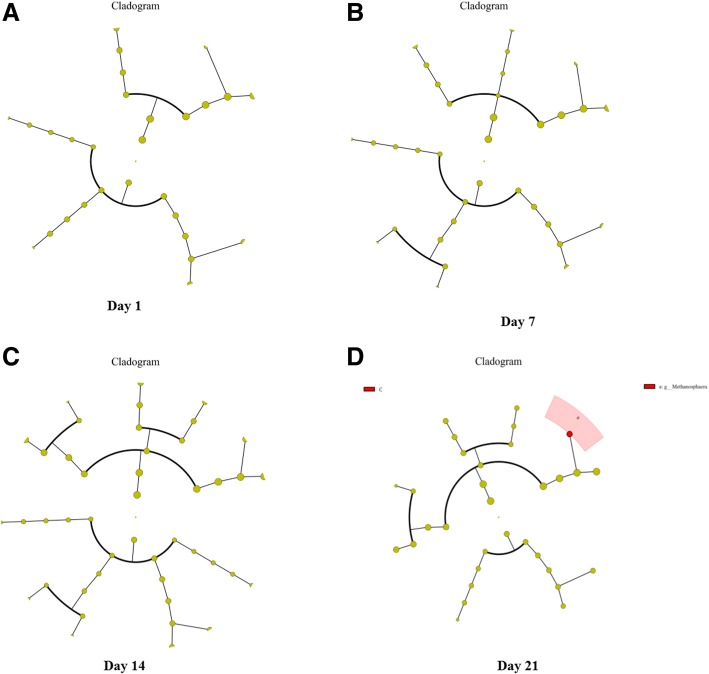
Fig. 7.
Cladograms, generated from LEfSe analysis, represent taxa enriched in Con (blue) or Dex (red) methanogens. The central point represents the root of the tree (methanogens), and each ring represents the next lower taxonomic level (phylum through genus). The diameter of each circle represents the relative abundance of the taxon. When full identification was not possible, g_ or s_ alone was used for genus or species, respectively. a Day 1 in rumen. b Day 7 in rumen. c Day 14 in rumen. d Day 21 in rumen

