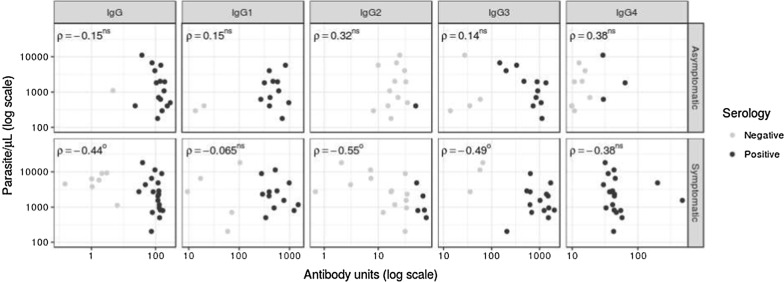
Fig. 2.
Correlation between parasite density with total IgG and subclass response levels stratified by asymptomatic or symptomatic carrier. Correlation coefficients were determined by Spearman’s method. We show data for individuals as a dotplot. Superscripts denote OP < 0.05; OOP < 0.01; ns non-significance

