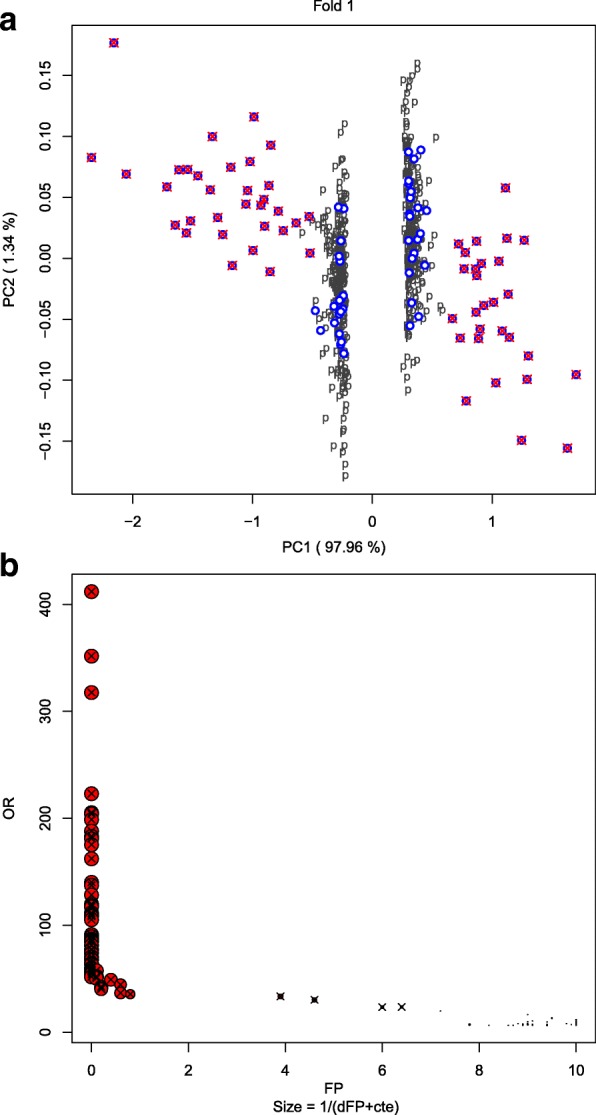
Fig. 3.

Illustrative example. a First two principal components of data corresponding to fold 1 (99.3% of explained variability), and there are represented: the potential genes (genes in S0.05) by circles; the false positives genes (genes in Rα,i) by “p"s, and the differentially expressed genes (genes generated as truly DE genes) by crosses. b Representation of the potential genes based on OR (vertical axis), FP (horizontal axis) and dFP (size of the circle is inversely proportional to its value). Truly DE genes are marked with a cross; in red and blue, genes belonging to cluster 1 and cluster 2, respectively
