
Fig. 5.
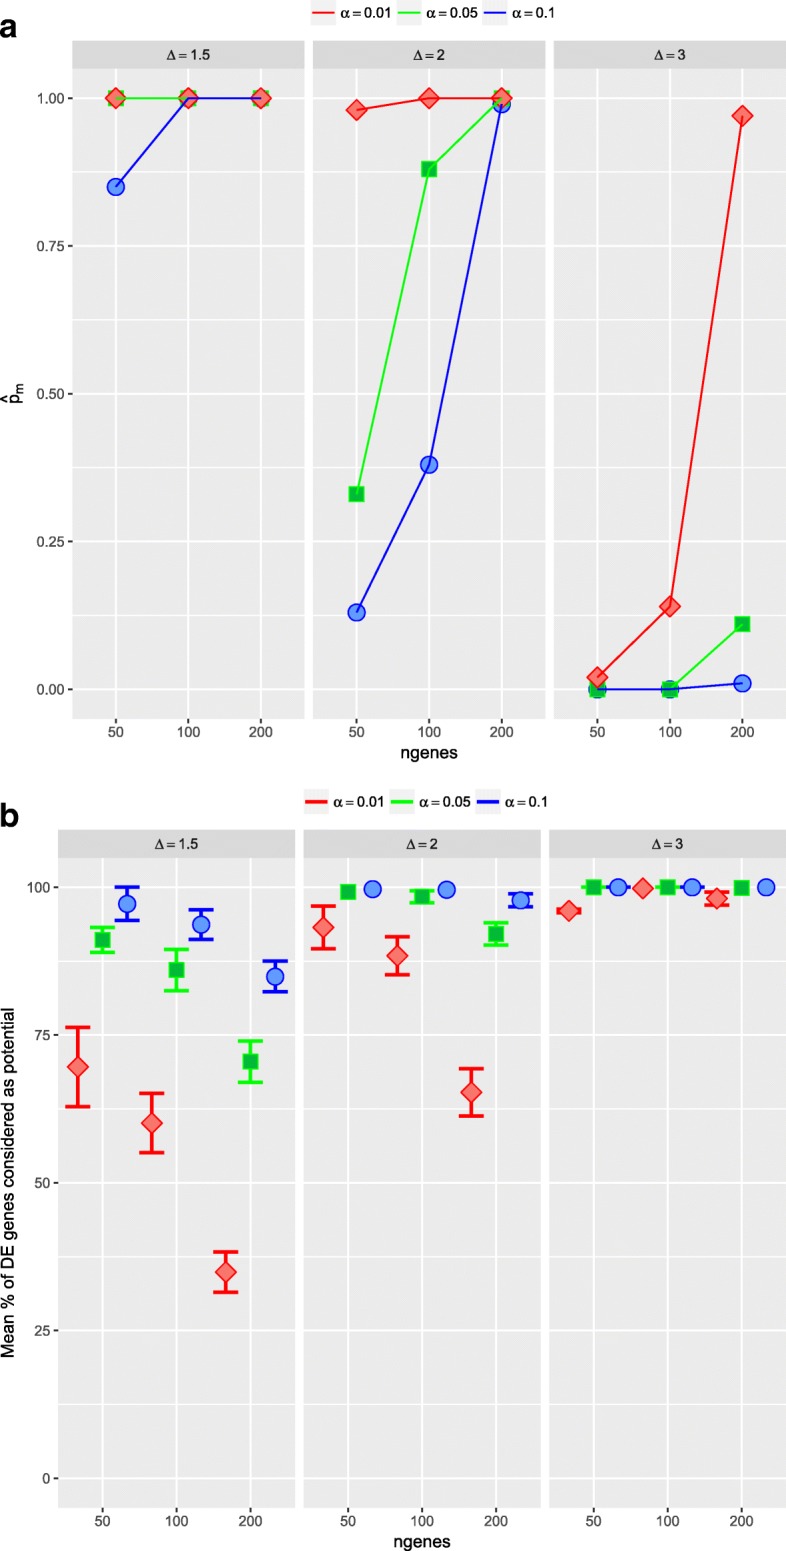
Simulation study 1, scenario 1 with nX=30, nY=10 and 100 runs. Evaluation of the first step of the ORdensity method using different values of α. Top: in x axis number of DE genes; in y axis estimated probability, , of no considering as potential DE gene at least one gene that it really is. Bottom: in x axis number of DE genes; in y axis mean proportion of DE genes that the procedure considered as potential DE genes