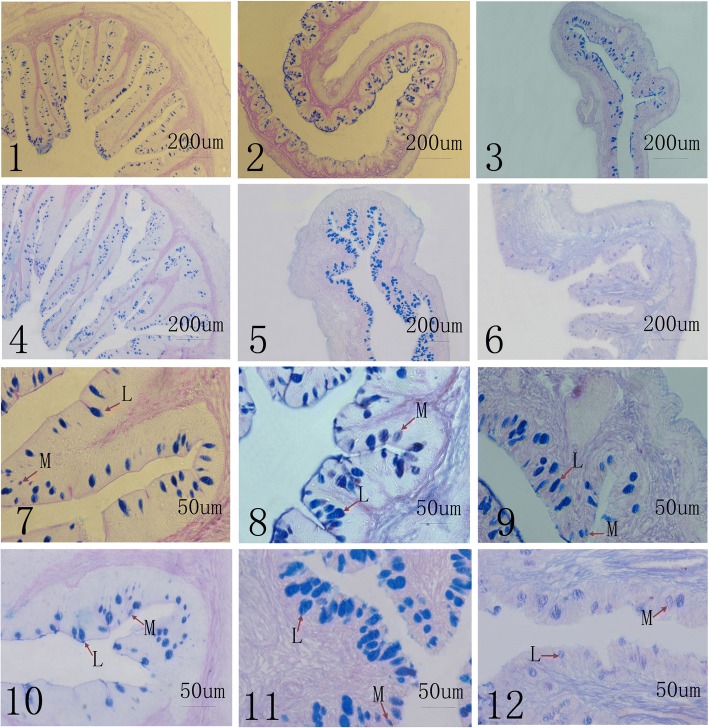
Fig. 1.
AB-PAS staining inverted microscopy micrographs (different parts of intestinal samples arbitrarily chosen as examples, 1-6: 100×; 7-12: 400×). 1, 2, 3, 7, 8 and 9 is the samples from paddy fields, and 4, 5, 6, 10, 11 and 12 is the samples from ponds. 1, 4, 7, 10: foregut; 2, 5, 8, 11: midgut; 3, 6, 9, 12: hindgut. L represent the acid mucous cells, M represent the partial acid mucous cells

