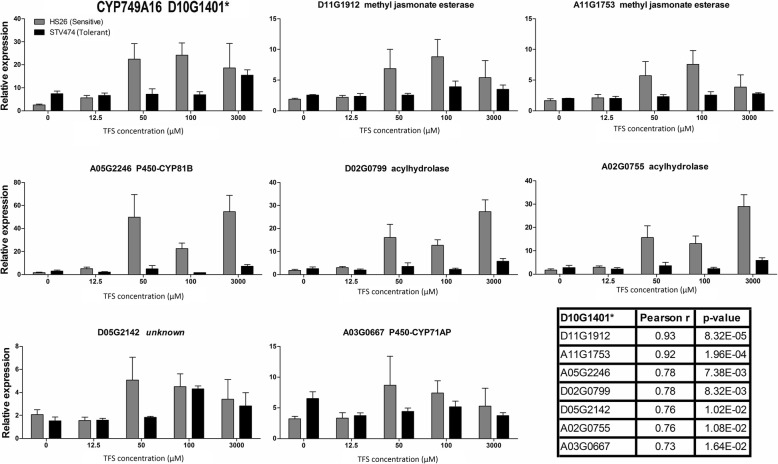
Fig. 2.
Response of select genes to TFS application in tolerant and sensitive cotton cultivars. Two-week old cotton plants were exposed to 0, 12.5, 50, 100 or 3000 μM TFS. The tolerant cultivar is STV474 and is shown with black bars, while the sensitive HS26 is grey. Error bars represent standard deviation from six biological replicates. The table shows Pearson’s pairwise correlation in expression patterns between tested genes and the TFS tolerance gene, CYP749A16 (Gh_D10G1401). See also Additional file 3: Figure S2

