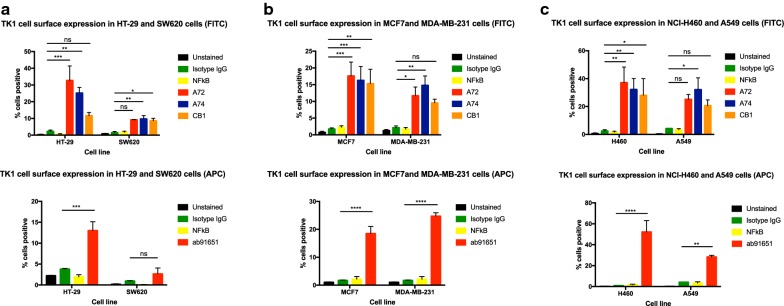
Fig. 1.
Membrane TK1 expression in of colon, breast, and lung cancer cell lines. Flow cytometry analysis of cell lines treated with anti-TK1 antibodies. a Quantification of TK1 expression on the cell membrane of HT-29 and SW620 cell lines stained with FITC or APC-conjugated anti-TK1 antibodies. b Quantification of TK1 expression on the cell membrane of MCF7 and MDA-MB-231 cell lines. The top bar graph shows MCF7 and MDA-MB-231 cell lines stained with FITC or APC-conjugated anti-TK1 antibodies. c Quantification of TK1 expression on the cell membrane of NCI-H460 and A549 cell lines stained with FITC or APC-conjugated anti-TK1 antibodies. Statistical analysis was performed by comparing the mouse isotype control fluorescent levels to those of A72, A74, CB1, or ab91651. *P ≤ 0.05; **P ≤ 0.005; ***P ≤ 0.001; ns = P > 0.05

