
Figure 5.
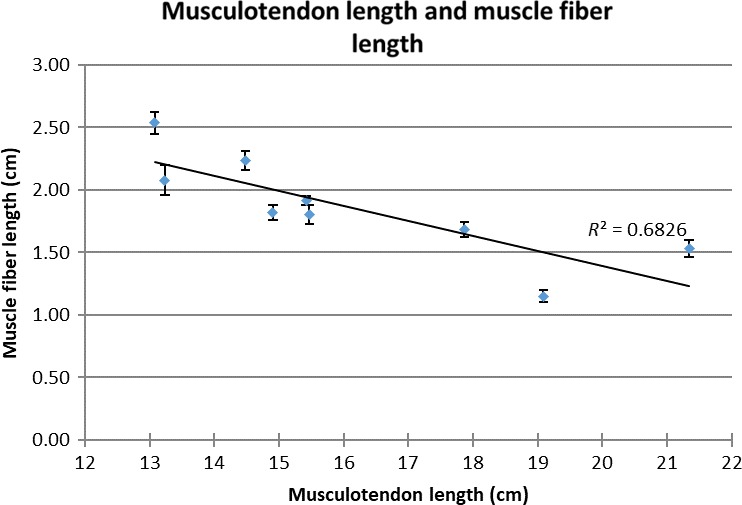
Scatterplot of muscle fibre length and musculotendon length. R 2, R‐square of the trendline. E, error bars denote the standard error.
Official websites use .gov
A
.gov website belongs to an official
government organization in the United States.
Secure .gov websites use HTTPS
A lock (
) or https:// means you've safely
connected to the .gov website. Share sensitive
information only on official, secure websites.
Scatterplot of muscle fibre length and musculotendon length. R 2, R‐square of the trendline. E, error bars denote the standard error.