Figure 6.

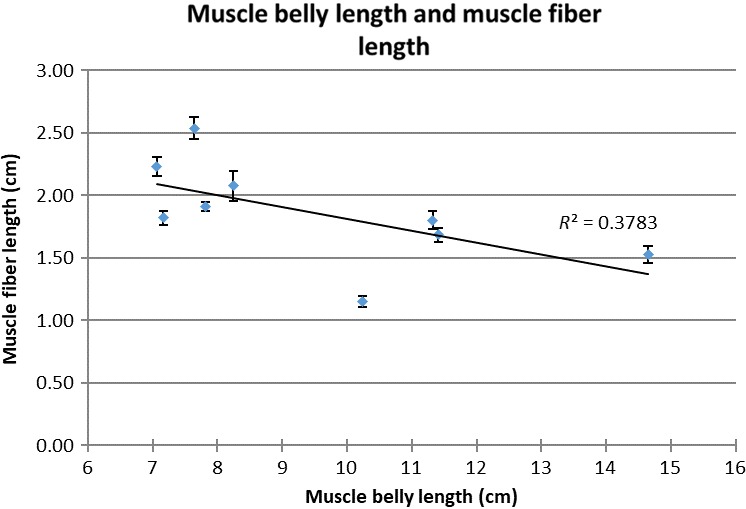
Scatterplot of muscle fibre length and muscle belly length. R 2, R‐square of the trendline. E, error bars denote the standard error.

Scatterplot of muscle fibre length and muscle belly length. R 2, R‐square of the trendline. E, error bars denote the standard error.