
FIGURE 1.
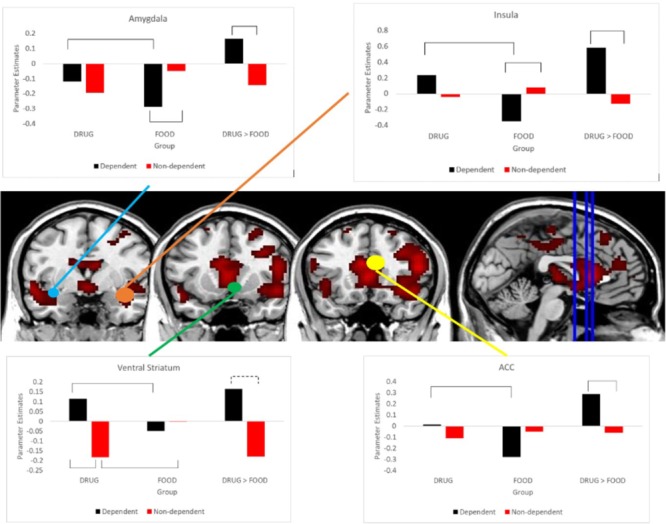
Differential sensitivity to DRUG and FOOD videos between groups. Bar-charts demonstrate differences in DRUG and FOOD reactivity between the Dependent and Non-dependent groups. Brackets indicate significant differences at p < 0.05. MRIcron images display intensity thresholds ranging from T = 6.17 – 22.56. Coronal slices register to MNI coordinate y = 0, y = 12, and y = 18, respectively.