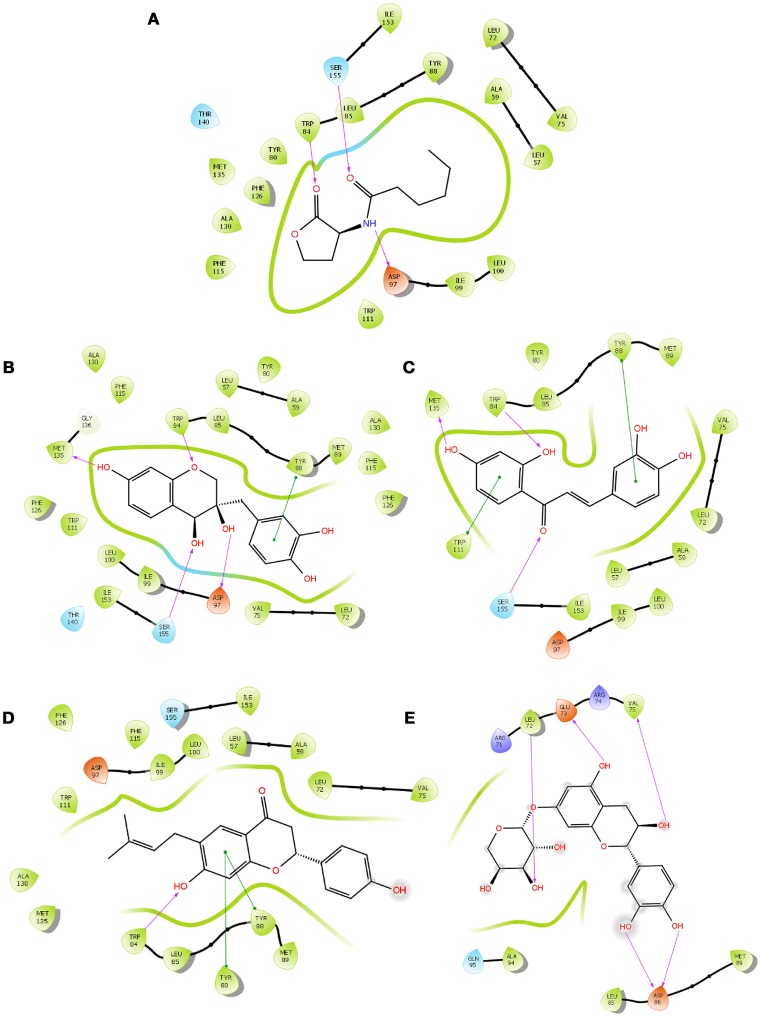
Figure 1.
The 2D interaction diagrams of QSIs against CviR. The purple arrows shows the H-bonds whereas the green lines shows the π-π stacking. (A) is for interaction map of C6HSL, (B) for interaction map of SPL, (C) for interaction map of BN1, (D) for interaction map of BN2 and (E) for interaction map of C7X against CviR. Most of the QSIs have at least one common bond forming aminoacid with C6HSL (Trp 84, Asp 97, Ser 155) and all of them have least GScore than C6HSL.

