
FIG. 3.
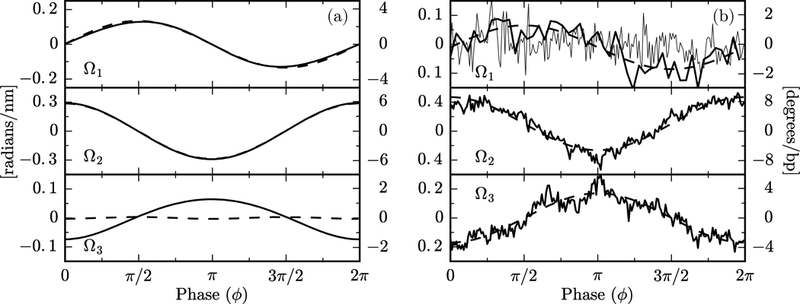
(a) Plot of average values of Ωi vs. ϕ from oxDNA1 (dashed lines) and oxDNA2 (solid lines) simulations. oxDNA2, but not oxDNA1, has a pronounced twist wave. Overall the data are in good agreement with Eqs. (4). A zoom-in of the Ω3 for oxDNA1 shows a very weak wave with frequency 2ω0. This is due to anisotropic bending, as discussed in the Supplemental Material [19]. The Ωi, as defined in (2), have units of inverse length, which are shown in the left vertical axis. The right axis is in degrees per base pairs, and is obtained by multiplying the left scale by 180a/π, with a = 0.34 nm the base pair separation.(b) Plot of the mean values of Ωi vs. the phase ϕ (analogously to Fig. 3), obtained from averaging over 145 nucleosome crystal structures. Noisy curves for Ω2 and Ω3 are simple averages over all structures; smooth curves show the Fourier component for ω0, indicating its dominance in the average, as well as the antiphase relation of Ω2 and Ω3 expected from the twist-bend coupling. Data for Ω1 averaged over all structures are extremely noisy (light noisy curve), but when selected structures with large power at ω0 are analyzed (darker curves) the π/2-phase-shifted signal expected from theory is observed (see text). The output of the software Curves+ [22] is in degree per bp, given in the right vertical axis.