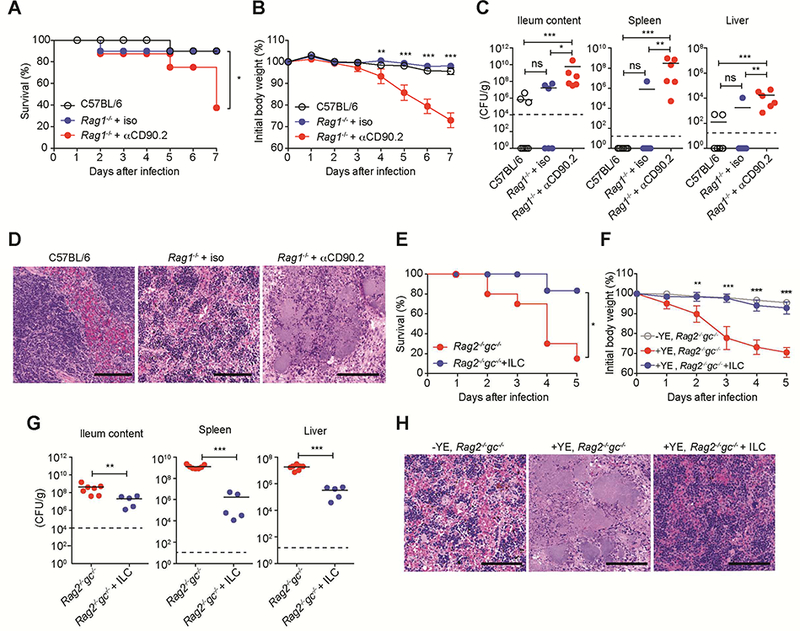
Figure 1. ILC are critical for host defense against YE infection.

(A-D) Rag1−/− mice were injected i.p. with αCD90.2 mAb or isotype control on days −4, −1, 2, 5. Mice were infected with 1.2 × 10⁸ YE CFU/mouse. (A) Survival curves. (B) Changes in body weight (% of baseline). (C) Bacterial burdens at day 7 p.i. (D) Representative H&E-stained splenic sections from the indicated mice at day 7 p.i. showing pale necrotic areas and bacterial colonies in mice treated with α-CD90.2. Scale bars, 100μm. (E-H) Sorted ILC (CD45+Lin−CD3−CD90.2+NK1.1−; 5 × 10⁵/mouse) from SI-LP of Rag1−/− mice were transferred by retro-orbital injection into Rag2−/−gc−/− recipients at day −1. Control mice were injected with PBS. Mice were infected with 1.4 × 10⁸YE CFU/mouse. (E) Survival curves. (F) Changes in body weight (% of baseline). (G) Bacterial burdens at day 5 p.i. (H) Representative H&E-stained splenic sections from the indicated mice at day 5 p.i. Scale bars, 100μm. Statistical analysis was performed using Log-rank test (A,E), 2 way ANOVA with Bonferroni’s multiple hypothesis correction (B,F), or Mann-Whitney test (C,G). Statistical significance is indicated by *, p < 0.05; **, p < 0.01; ***, p < 0.001. Data shown are mean±SEM (B,F). Bars show the mean, symbols represent individual mice. Dotted horizontal line represents the limit of detection (C,G). Data represent pooled results from at least two independent experiments having at least three mice per group in each experiment (n=6–10 mice per group; co-housed). (A-C, E-G). Two independent experiments were carried out yielding similar results (D,H). See also Figure S1.
