
Figure 2. An ILC3 subset is essential for protection against enteric bacterial infection.
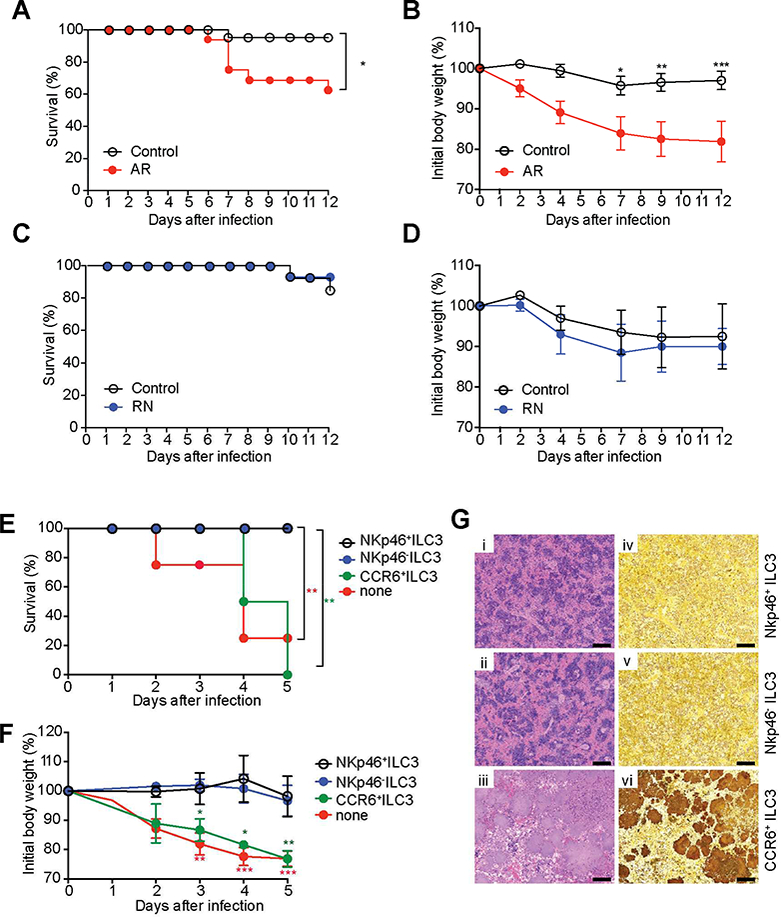
(A-D) Survival curves (n=13–16 per group) (A,C) and changes in body weight (B,D) of AR mice (Rorc-cre × Ahrfl/fl mice, which are selectively deficient for ILC3) and RN mice (NKp46-cre × Rorcfl/fl mice, which selectively lack NKp46+ILC3 as well as ex- ILC3). (E-G) NKp46− ILC3 (Lin−CD3−NK1.1−CD90.2highCD45intCCR6−NKp46−), NKp46+ ILC3 (Lin−CD3−NK1.1−CD90.2highCD45intCCR6−NKp46+), and CCR6+ ILC3 (Lin−CD3− NK1.1 CD90.2highCD45intCCR6+NKp46−) were sorted from SI-LP of Ragr−/− mice. Sorted cells (5 × 10⁵ cells/mouse) were transferred by retro-orbital injection into Rag2−/−gc−/− recipients at day −1, and then mice were infected with 1.2 × 10⁸ YE CFU/mouse (n=6–8 per group; co-housed). (E) Survival curves. (F) Changes in body weight. (G) Representative H&E-stained (i-iii) and Warthin-Starry silver stained (iv-vi) splenic sections, demonstrating large colonies of YE, from the indicated mice at day 5 p.i. Scale bars, 100μm. Two independent experiments were carried out yielding similar results. Statistical analysis was performed using Log-rank test (A,C,E) or 2 way ANOVA with Bonferroni’s multiple hypothesis correction (B,D,E). Statistical significance is indicated by*, p < 0.05; **, p < 0.01; ***, p < 0.001, and statistical significance in E and F is indicated by red stars (NKp46−ILC3 vs none or NKp46+ILC3 vs none) and green stars (NKp46− ILC3 vs CCR6+ILC3 or NKp46− ILC3 vs CCR6+ILC3). Data in B, D and F show mean±SEM. Data represent pooled results from two independent experiments having at least three mice per group in each experiment. See also Figure S2.