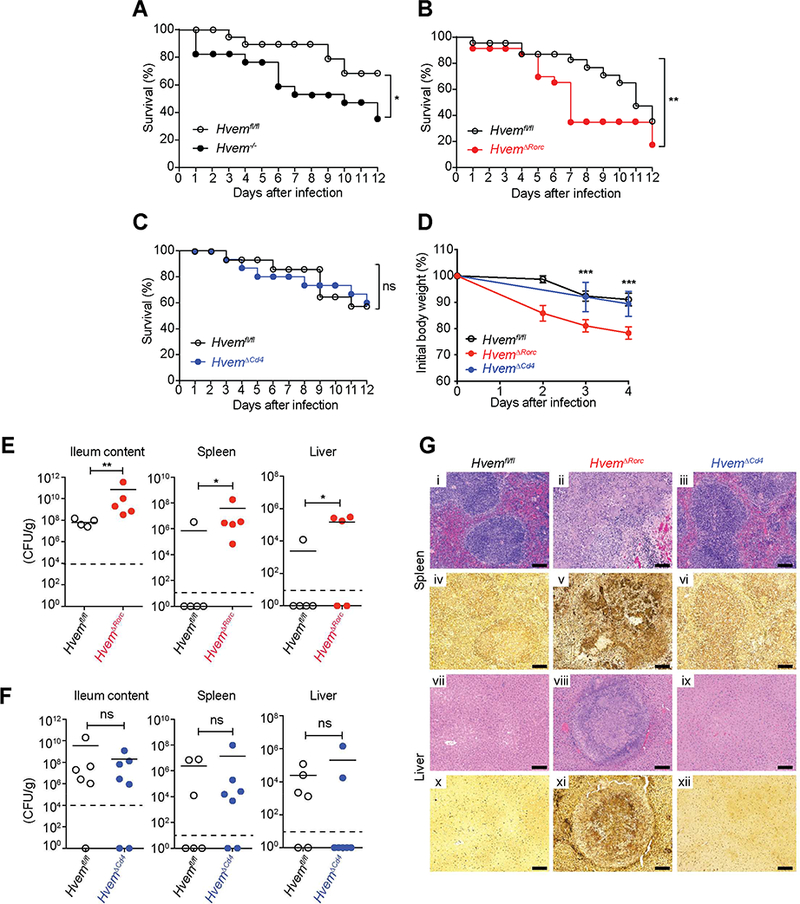
Figure 5. HVEM expression by RORγt+ ILC3 is required for host defense.

Groups of mice were infected orally with YE. (A-C) Survival curves (A,1×108 YE CFU/mouse; B,1.2×108 YE CFU/mouse; C,1.4×108 YE CFU/mouse; A-C, n=17–23 per group). (D) Changes in body weight (1.1×10⁸ YE CFU/mouse;n=5 per group). Data shown are mean±SEM. (E-F) Bacterial burdens (E, 1.2 × 10⁸ YE CFU/mouse; F, 2 × 10⁸ YE CFU/mouse;n=5 per group) at day 7 p.i. In E and F, bars show the mean, symbols represent individual mice, and dotted horizontal line represents the limit of detection. (G) Representative H&E stained (i-iii,vii-ix) or Warthin-Starry silver stained (iv-vi, x-xii) tissue sections from the indicated mice at day 7 p.i. (1.1 × 10⁸ YE CFU/mouse). Images of spleen (i-vi) and liver (vii-xii). Scale bars, 100μm. Two independent experiments were carried out yielding similar results. Statistical analysis was performed using Log-rank test (A-C), 2 way ANOVA with Bonferroni’s multiple hypothesis correction (D), or Mann- Whitney test (E,F). Statistical significance is indicated by *, p < 0.05; **, p < 0.01; ***, p < 0.001; ns, not significant. Data represent pooled results from at least two experiments (A-C, E-F) or representative results of two independent experiments with at least four mice in each experimental group (D). All mice were co-housed littermates. See also Figure S4.
