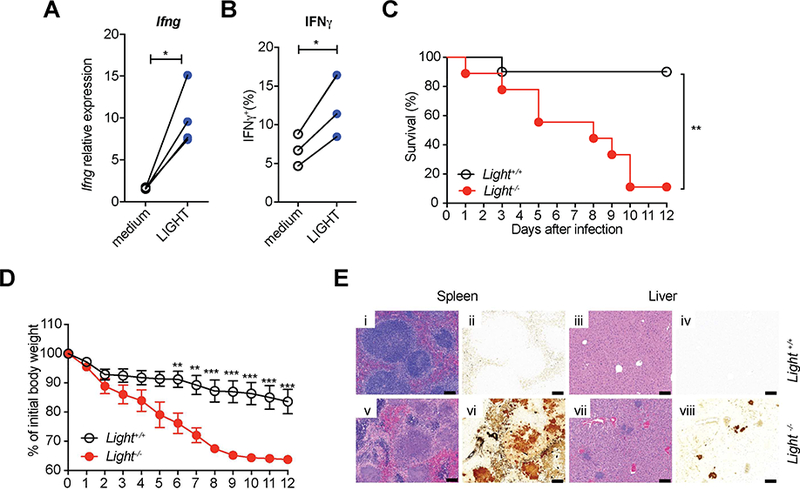
Figure 7. LIGHT provides the ligand for HVEM in ILC.

(A) LIGHT induces Ifng expression by ILC. Sorted ILC (CD45+Lin−CD3−CD90.2+) from SI-LP of Rag1−/− mice were cultured with IL-7 and IL-23 in the presence or absence of soluble LIGHT for 18 hours. Ifng transcript was determined by qPCR. (B) IFNγ expression by intracellular cytokine staining. Sorted ILC were cultured with IL-7 in the presence or absence of soluble LIGHT for 18 hours, and then were stimulated for 4h with PI and BFA was added in the last 2h of incubation before analysis. (C-E) Ligh−/− mice and control mice were infected orally with 1.6 × 10⁸ YE CFU (n=9–10 per group; co-housed). (C) Survival curves. (D) Changes in body weight. Data show mean±SEM. (E) Representative H&E stained (i,iii,v,vii) or Warthin-Starry silver stained (ii,iv,vi,viii) tissues from the indicated mice at day 7 p.i. Images of spleen (i,Ν,ν,νi) and liver (iii,iv,vii,viii). Scale bars, 100μm. Two independent experiments were carried out yielding similar results. Statistical analysis was performed using Mann-Whitney test (A,B), Log-rank test (C), or 2 way ANOVA with Bonferroni’s multiple hypothesis correction (D). Statistical significance is indicated by *, p < 0.05; **, p < 0.01; ***, p < 0.001. Data show representative results of two independent experiments with at least three mice in each experimental group. See also Figure S6 and S7.
