
Figure 5: Expression patterns of immunoregulatory proteins coincide with TNBC architecture.
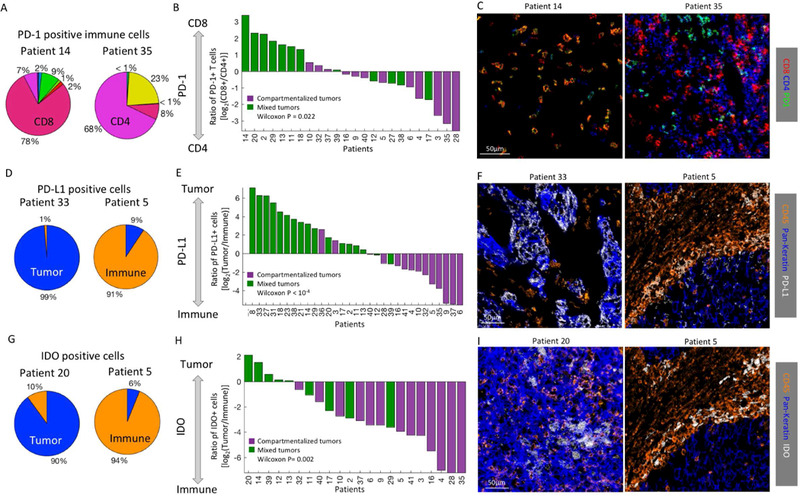
(A) PD-1+ immune cell composition in two patients. Immune populations are color-coded as in 2E. (B) For all patients with over 20 PD-1+ cells (x-axis) shown is the log ratio of PD-1+CD8+ and PD-1+CD4+ T-cells. Patients are colored by their spatial architectures. Mixed tumors tend to have more PD-1+CD8+ T cells than PD-1+CD4+ T cells, as determined by Wilcoxon rank-sum test. (C) Color overlay of CD8, CD4 and PD-1. (D) PD-L1+ cell composition in two patients. (E) Same as B, showing the log ratio of PD-L1+ tumor and immune cells. (F) Color overlay of CD45 (immune), Pan-keratin (tumor) and PD-L1. (G) IDO+ cell composition in two patients. (H) Same as B, showing the log ratio of IDO+ tumor and immune cells. (I) Color overlay of CD45 (immune), Pan- keratin (tumor) and IDO.