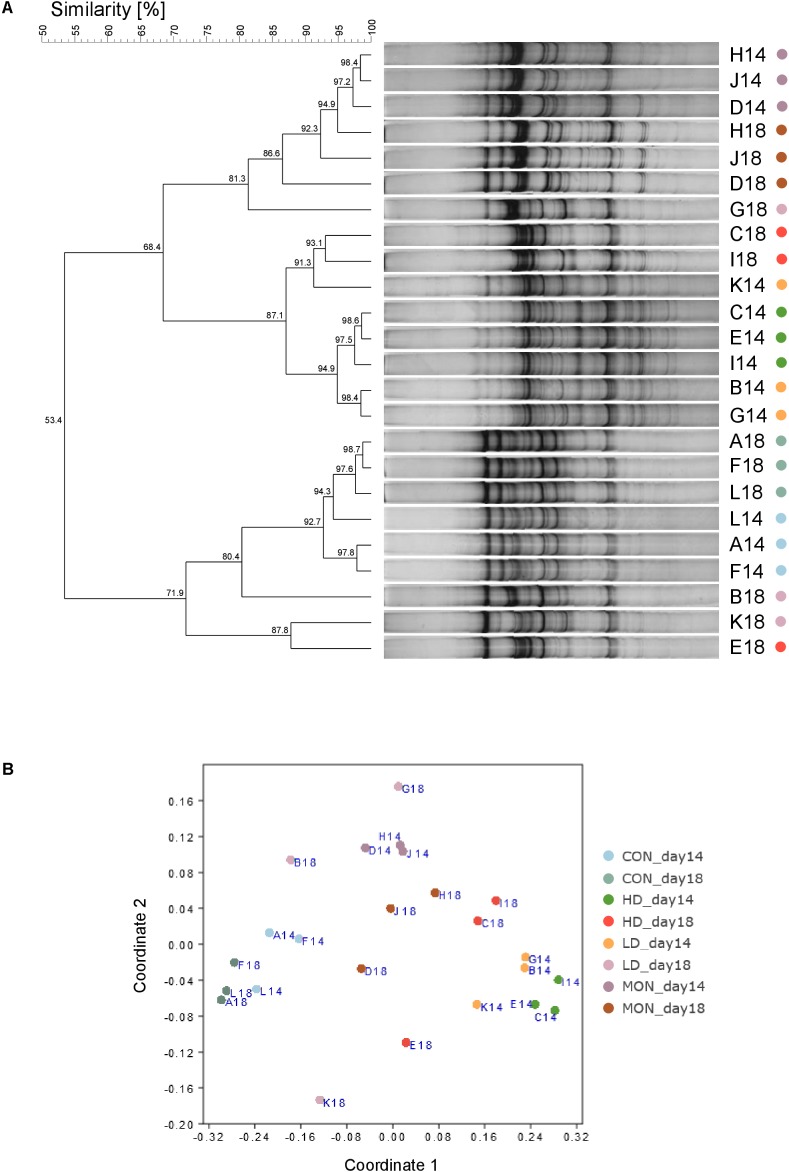
FIGURE 2.
Similarities of archaeal communities analyzed by single strand conformation polymorphism. Dendrogram analysis based on UPGMA clustering was used to compare similarities of band patterns on the SSCP gel (A) and the similarity matrix was visualized as NMDS plot (B, Stress = 0.09). During the experimental period fermenters A, F, L received no addition (CON14, light blue), fermenters B,G,K received 1 g of the experimental mixture (LD14, orange), fermenters C, E, I were treated with 2 g of the experimental mixture (HD14, dark green) and 4.1 mg Monensin was added to fermenters D, J, H (MON14, dark purple). During withdrawal period no additions were made (CON18, blue green; LD18, light purple; HD18, red; MON18, brown).

