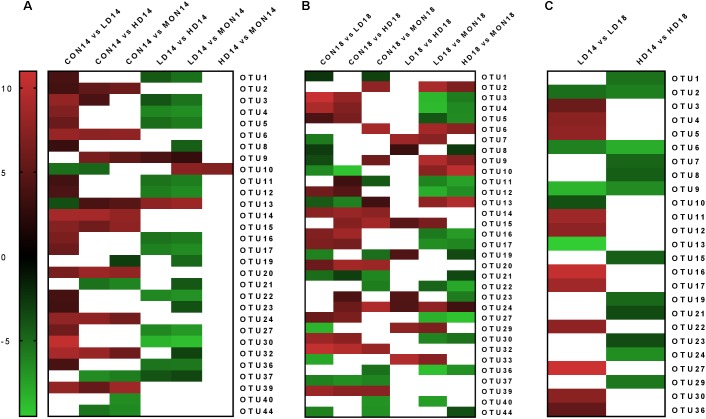
FIGURE 5.
Significant changes (P < 0.05) in the normalized abundance of archaeal operational taxonomic units (OTUs). Differential OTU analysis based on normalized abundance counts contrasting the different experimental groups was performed using the software DESeq2 v1.12.4. P-values were corrected for multiple comparisons using Benjamini–Hochberg correction. In the heatmap, the log2 fold change of significantly different abundant OTUs (P < 0.05) is indicated by the red to green color scale. A threshold of ±2 was used for the log2 fold change. White areas indicate that no significant differences were observed, or the log2 fold change was between –2 and +2. Changes are depicted among treatment groups at day 14 (A, CON: control group, LD: 1 g of the experimental mixture per day, HD 2 g of the experimental mixture per day, MON: 4.1 mg Monensin per day), among treatment groups at day 18 (B, withdrawal period: no additions) and within treatment groups among days (C).

