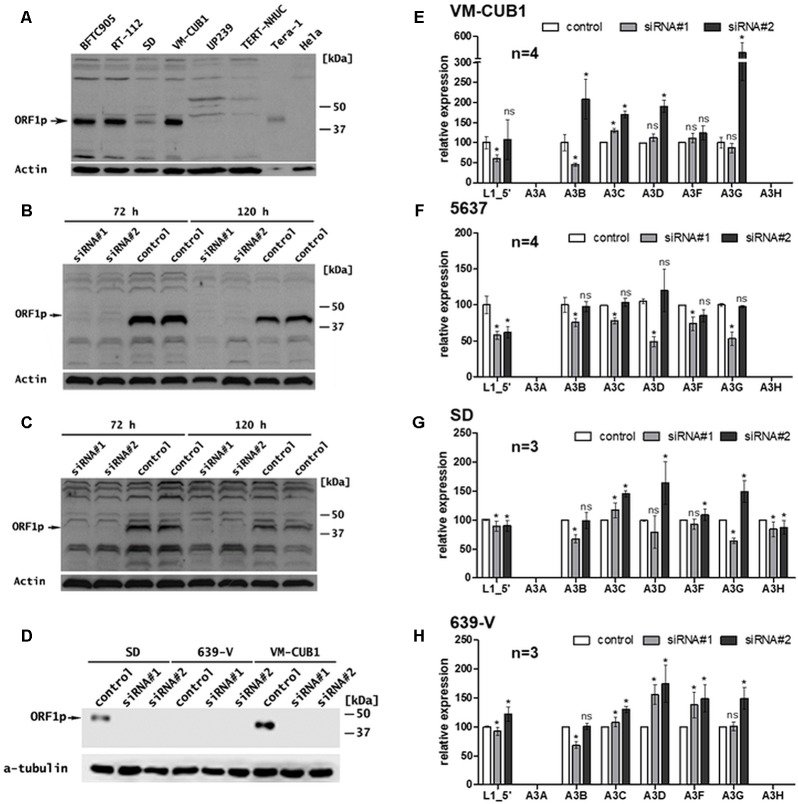
FIGURE 2.
Effects of transcriptional knockdown of endogenous FL-L1 expression on transcription of the APOBEC3 gene family members in UCCs. (A) L1 ORF1p expression was analyzed in selected UCCs (BFTC905, RT-112, SD, and VM-CUB1) and benign urothelial samples (UP239, TERT-NHUC) by immunoblot analyses using an anti-ORF1p antibody. Tera-1 (highly diluted) and HeLa protein extracts were used as positive and negative control for L1 ORF1p expression, respectively. L1 ORF1p expression was determined in VM-CUB1 (B), 5637 (C), SD, and 639-V (D) UCCs after treatment with 20 nM control or L1-specific siRNAs for 72 h (B,C) and 120 h (B–D) by immunoblot analysis. β-actin or tubulin protein was detected as loading control. Note longer exposure in (C). In (D) VM-CUB1 served as a positive control for siRNA treatment. mRNA expression of L1, A3A, A3B, A3C, A3D, A3F, and A3G was assessed in VM-CUB1 (E), 5637 (F), SD (G), and 639-V (H) UCCs by RT-qPCR after 72 h treatment with 20 nM LINE-1 specific siRNAs and control siRNA. Relative expression levels were calculated using TBP mRNA levels as a reference transcript and expression in control siRNA treated samples were set as 100. “n” represents the number of independent knock down experiments. Data were represented as means ± standard deviations (error bars). P-values were calculated using t-tests. Asterisk represents statistically significant difference: ∗P < 0.05 and ns, not significant.

