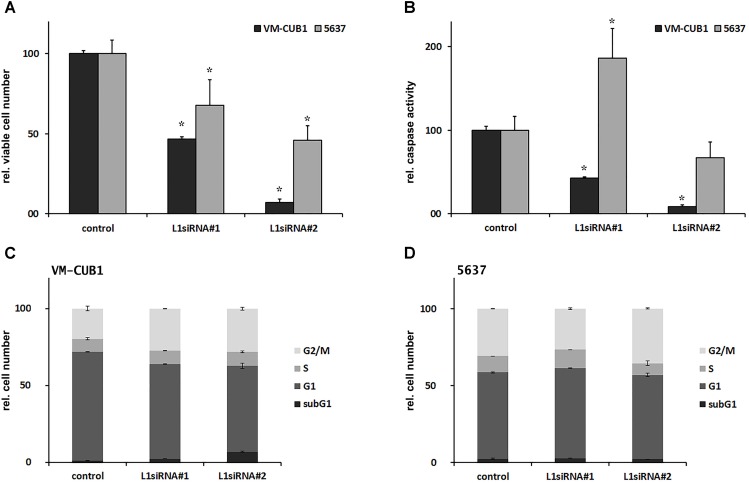
FIGURE 5.
Phenotypical consequences of L1 siRNA treatment in selected UCCs. (A) Cell viability and (B) caspase activity (both depicted as percent of control) were determined in VM-CUB1 and 5637 UCCs after 72 h treatment with 20 nM control siRNA or L1 siRNAs (each n = 5–8). Cell cycle distribution in (C) VM-CUB1 and (D) 5637 cells (each n = 2). Data were represented as means ± standard deviations (error bars). P-values for (A,B) were calculated using Mann–Whitney U Test. Asterisk represents statistically significant difference: ∗P < 0.05 and ns, not significant.

