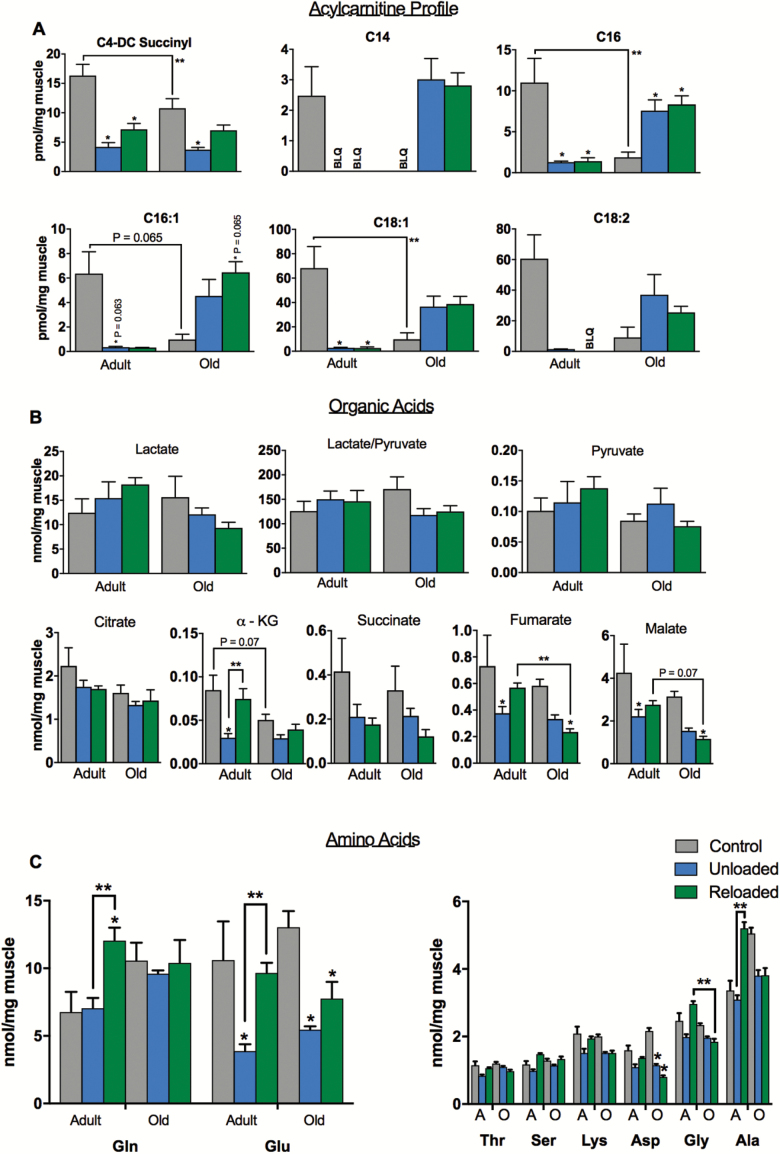
Figure 3.
Acylcarnitine, organic acid, and amino acid profiles during unloading and reloading. (A) Acylcarnitine profile in soleus of adult and old mice during control, unloading, and reloading conditions. Acyl chain length and degree of saturation are denoted by standard nomenclature (C:D, where C is the number of carbon atoms and D is the number of double bonds). (B) Metabolite profiles showing lactate and pyruvate and organic acid intermediates of the tricarboxylic acid (TCA) cycle. (C) Amino acids profile in soleus during control, unloading, and reloading conditions. n = 6 per group. Data are presented as mean ± SEM. **p <0.05 ANOVA/Bonferroni correction. *p <0.05 versus control ANOVA/Bonferroni correction. ANOVA = analysis of variance; BLQ = below limit of quantification.

