Figure 4.
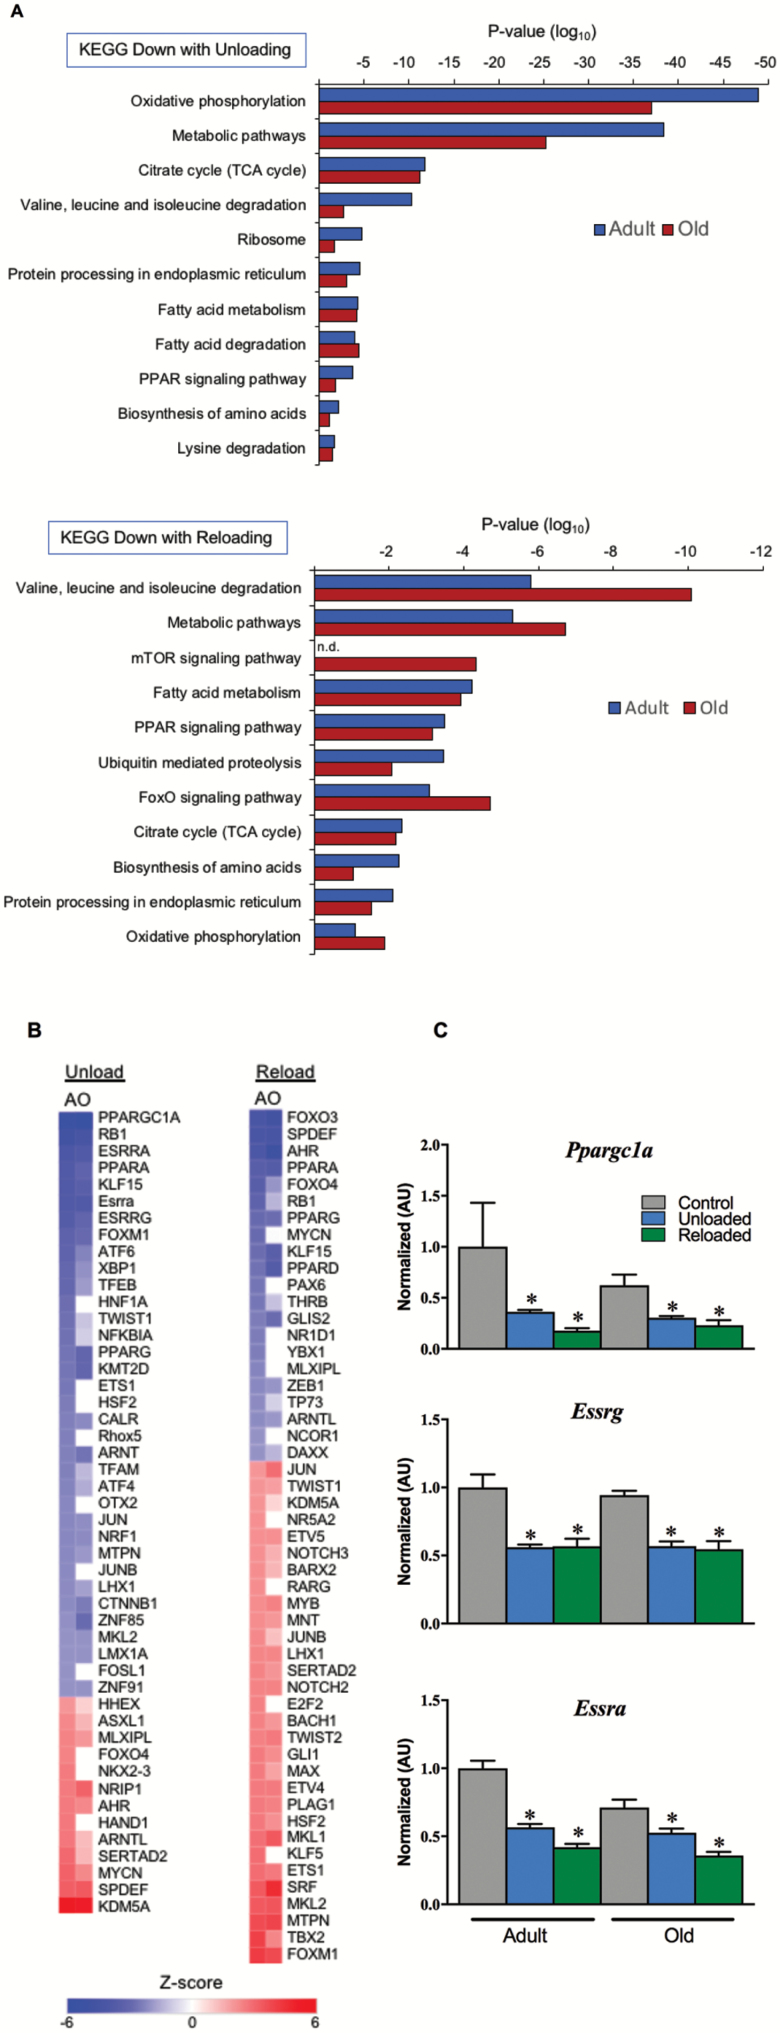
Gene regulatory networks for oxidative metabolism are suppressed during unloading and do not recovery following 3 days of reloading. (A) KEGG pathway analysis of RNA-sequencing data set representing significantly downregulated pathways relating to mitochondria, metabolism, and protein metabolism during unloading and after 3 days of reloading. (B) Heatmap depicting IPA Upstream Regulator analysis to identify upstream transcriptional regulators responsible for the transcriptomic profile seen with unloading and reloading, plotted as a centralized Z-score for each transcription factor. The RNA-sequencing data set used was filtered with reads per kilobase per million mapped reads (RPKM) >1, p <0.05. (C) RT-qPCR assay for expression of key nuclear transcription factors that drive mitochondrial energy metabolism. n = 4–9 per group. Data are presented as mean ± SEM. *p <0.05 versus control ANOVA/Bonferroni correction. FOXO = Forkhead box O; KEGG = Kyoto Encyclopedia of Genes and Genomes; mTOR = mammalian target of rapamycin; RT-qPCR = reverse transcription-quantitative polymerase chain reaction; TCA = tricarboxylic acid.

