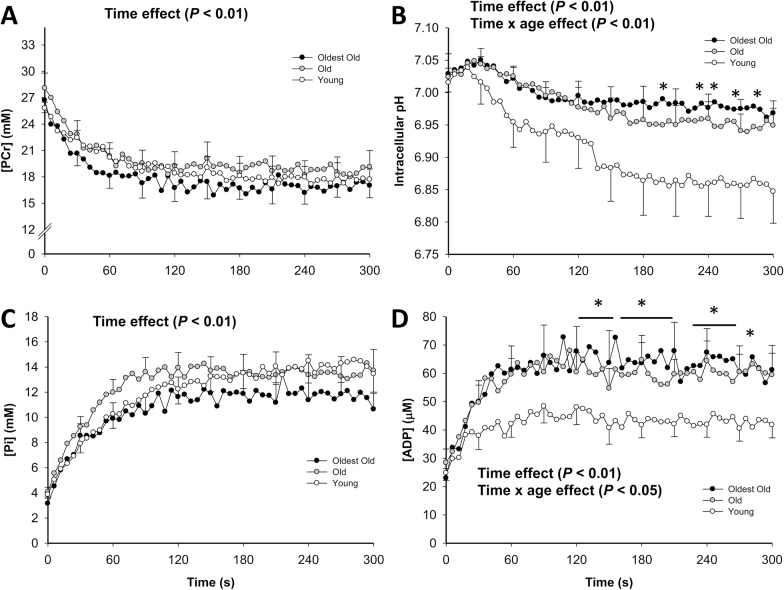
Figure 1.
Changes in phosphocreatine (PCr) (A), intracellular pH (B), inorganic phosphate (Pi) (C), and adenosine diphosphate (ADP) (B) with respect to time at the onset of plantar flexion exercise in young (empty circles, female = 6; male = 5; n = 11), old (gray circles, female = 6; male = 5; n = 11), and oldest-old (black circles, female = 4; male = 6; n = 10). Values are presented as means ± SEM. *Significantly different from young at the same time point (p < .05).

