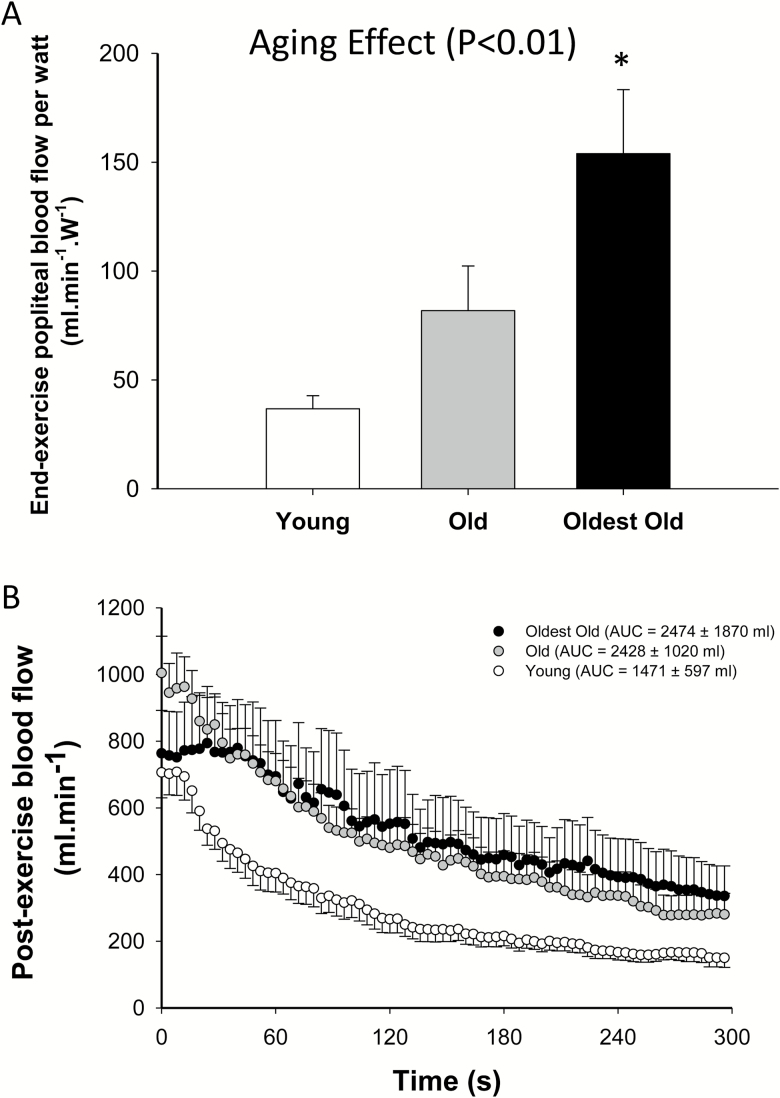
Figure 4.
(A) Mean of the initial blood flow per watt; (B) blood flow changes with respect to time at the offset of plantar flexion exercise in the young (empty circles, female = 6; male = 5; n = 11), old (gray circles, female = 6; male = 5; n = 11), and oldest-old (black circles, female = 4; male = 6; n = 10). *p < .05, significantly different from both the young and old. Values are presented as mean ± SEM.

