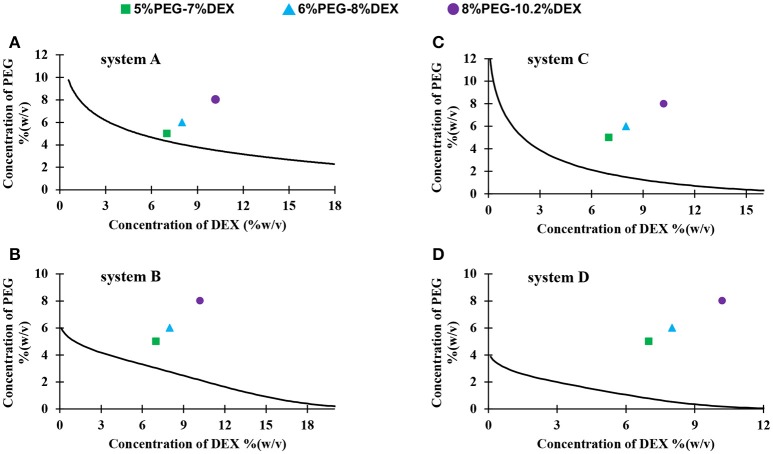
Figure 1.
Binodal curves of four systems made with different molecular weights PEG and DEX: (A) PEG8k-DEX40k, (B) PEG8k-DEX500k, (C) PEG35k-DEX40k, and (D) PEG35k-DEX500k. Colored symbols show the resulting concentrations of PEG and DEX in the partition assay; square: 5%PEG-7%DEX, triangle: 6%PEG-8%DEX, and circle: 8%PEG-10.2%DEX.

