Fig. 1.
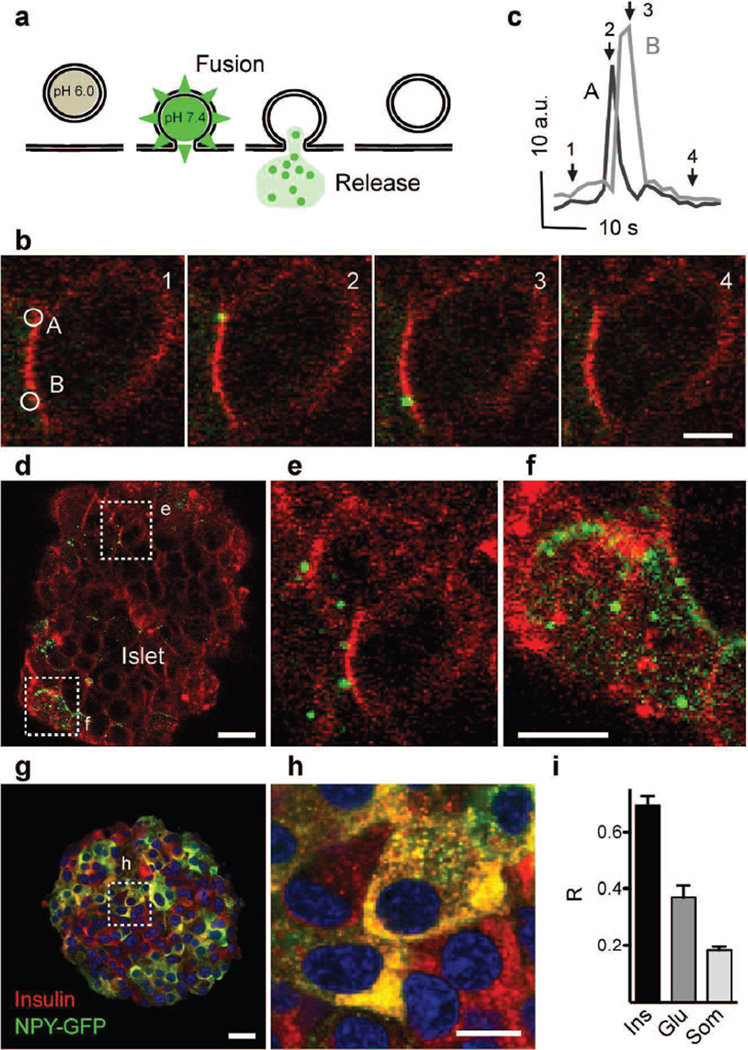
Imaging insulin granule secretion in intact human islets. (a) The vesicle cargo NPY fused to pHluorin is used to follow insulin granule dynamics in real time. (b) Confocal images showing vesicle secretion (green) at the plasma membrane (red, labelled with di-8-ANEPP) of a cell within an intact human islet, triggered by high glucose, at particular times indicated in (c). (c) Traces of the changes in fluorescence intensity in ROIs A and B shown in (b); AU, arbitrary units. Arrows indicate time points of images in (b). (d–f) Temporal stack of 20 images (30 s) of a single confocal plane showing high glucose-triggered vesicle secretion in two cells (d) cut transversally by the confocal plane (e) and a cell cut tangentially and exposing its surface (f). (g, h) Confocal image (g) and higher magnification (h) of an isolated islet immunostained for insulin (red) and GFP (green). (i) Quantification of data in (g) showing Mander’s overlap coefficients (R), n=5 islets. Ins, insulin; Glu, glucagon; Som, somatostatin. Scale bars, 5 µm (b, h), 10 µm (f) or 20 µm (d, g)

