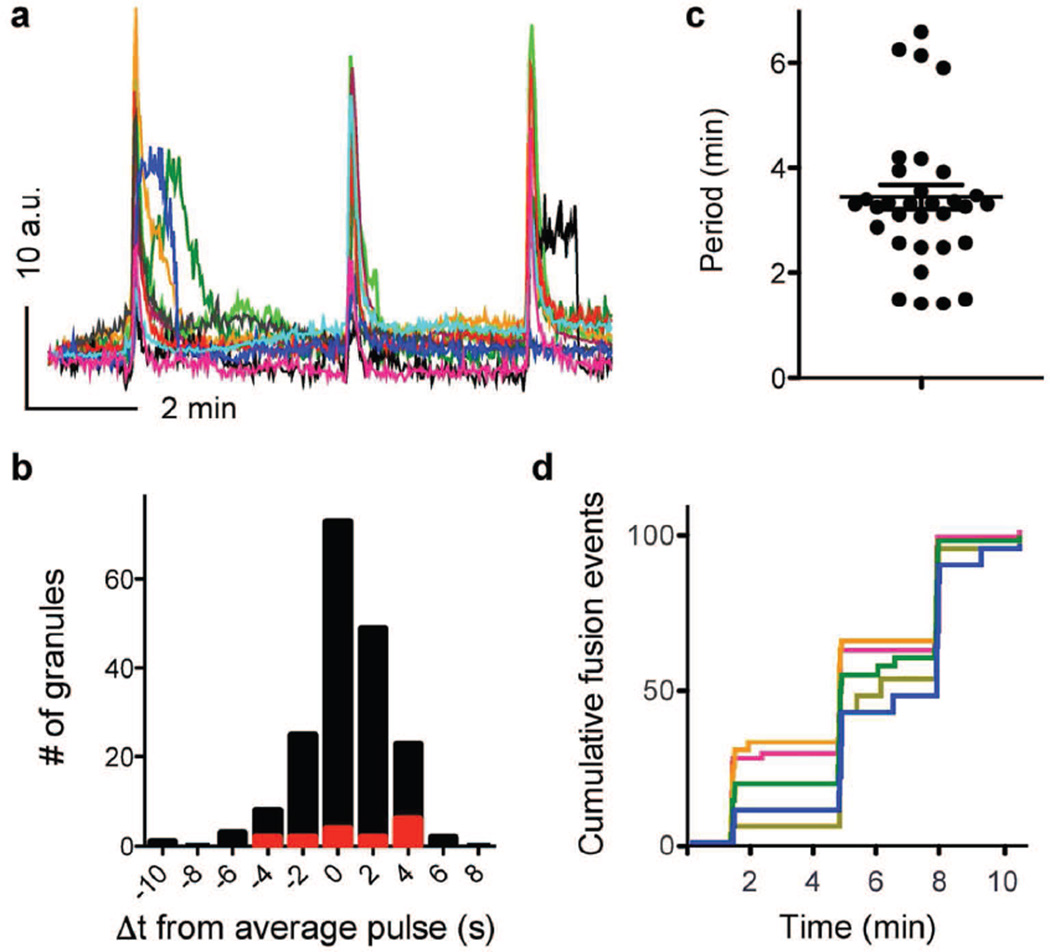
Fig. 2.
Secretory events are highly synchronised and generate discrete pulses of secretion in individual beta cells. (a) Traces of fluorescence intensity in ROIs placed around individual secretory sites in a beta cell within an intact islet during sustained stimulation with 16 mmol/l glucose; AU, arbitrary units. Each colour represents an individual site. (b) Histogram showing the difference in time (Δt) from the start of each secretory event to that of the cell response. Black bars, with IBMX/forskolin; red bars, without IBMX/forskolin. (c) Time between bursts of vesicle secretion (period), n=9 cells, n=3 islet preparations. Periods varied within a cell, from cell to cell, and from preparation to preparation. Line represents the average period ± SEM. (d) Running sum of the number of secreted vesicles (each coloured trace represents secretory events from a single cell; n=5 cells, normalised to the total number of secretion events). Three bursts of vesicle secretion can be distinguished

