Fig. 3.
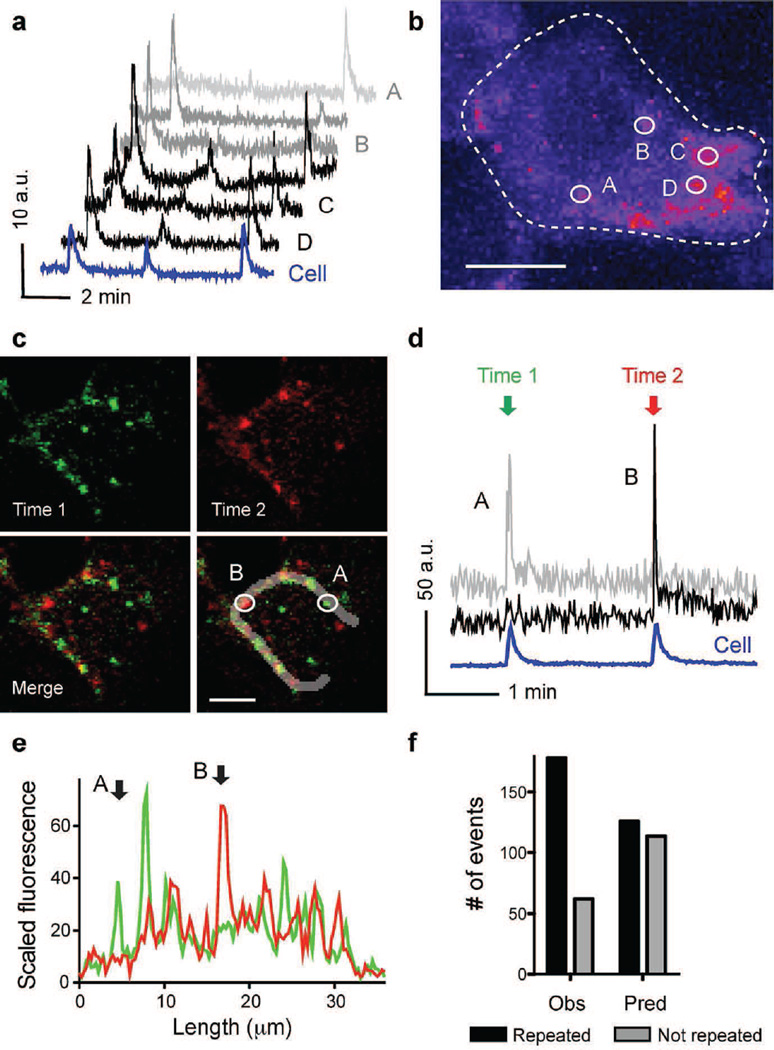
Secretory events show distinct spatial patterns within a beta cell. (a) Traces of fluorescence intensity in ROIs placed around individual secretory sites during high glucose condition. At some sites secretion occurred repeatedly (black traces), while at others it only occurred once (grey traces); AU, arbitrary units. (b) Temporal stack (13 min 20 s) of confocal images (n=536) of a cell showing the sum of granule secretion during sustained stimulation with high glucose. Fluorescence intensity is highest where more secretory events occurred (pseudocolour scale). Circles denote ROIs for the traces shown in (a). (c) Temporal stacks (30 s) of confocal images of a cell showing secretory events during two secretory bursts (first in green [Time 1], second in red [Time 2]). Scale bar, 5 µm (b, c). (d) Traces of fluorescence intensity in ROIs placed around the individual secretory sites shown in (c). (e) Line scans along the cell membrane outline in (c) showing the profile of fluorescence intensity during the first (green) and second secretory burst (red). Secretory events did not recur at sites A and B (ROIs shown in [c]). (f) Quantification of recurrence of secretory events using line scans as those in (e). Bars represent values from a contingency table (black and grey bars for repeated and not repeated events, respectively). The observed number (Obs) of recurring secretory events (black bars) was higher than the predicted number (Pred) (Fisher exact test, p<0.01, n=13 cells, n=4 islets)

