Fig. 5.
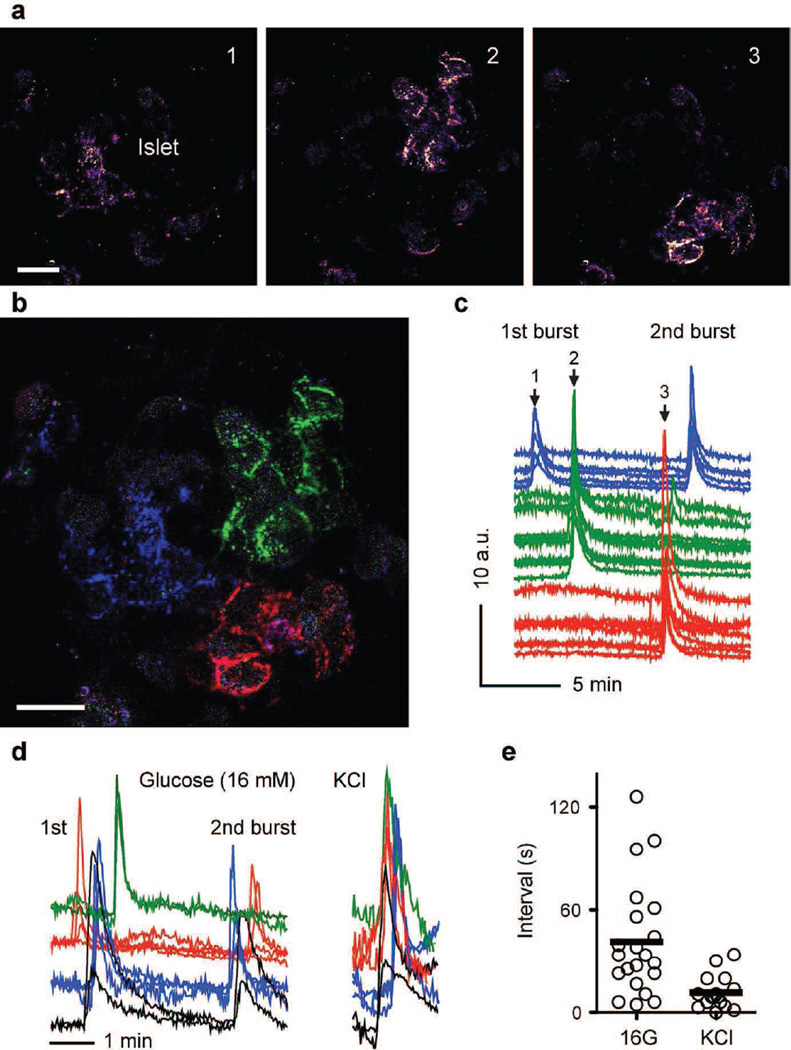
Islet cells form discrete clusters of synchronised activity. (a) Sequence of temporal stacks (30 s) of confocal images showing secretory events stimulated by high glucose in an intact human islet. (b) Merged image of the temporal stacks shown in (a), with secretory events colour-coded: blue at time 1; green at time 2 and red at time 3. Three non-overlapping clusters comprising ~10 cells become visible. Scale bars, 20 µm. (c) Traces of secretory responses from cells shown in (b), with corresponding colours; AU, arbitrary units. Arrows indicate when images in (a) were acquired. (d) Traces of secretory responses from cells in response to high glucose and KCl stimulation (neighbouring cells in a cluster in same colour). The sequence in the activation of cell clusters changes from burst to burst. (e) Quantification of delays in the secretory responses between different clusters in the same islet stimulated with high glucose (16 G) or KCl. Lines represent average values (n=3–6 regions per islet, n=3 islets)

