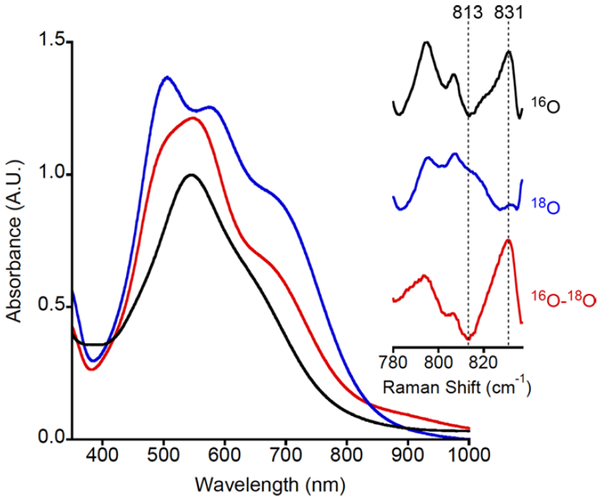
Figure 3.
UV−vis spectra (blue = 3a, red = 3b, and black = LCuIIIOH; all samples 0.1 mM in THF at −80 °C) and (inset) resonance Raman spectra for 3a, for samples prepared from R16O16OH (black, top) or R18O18OH (blue, middle), with difference spectrum shown in red (bottom). Conditions are noted in the text.

