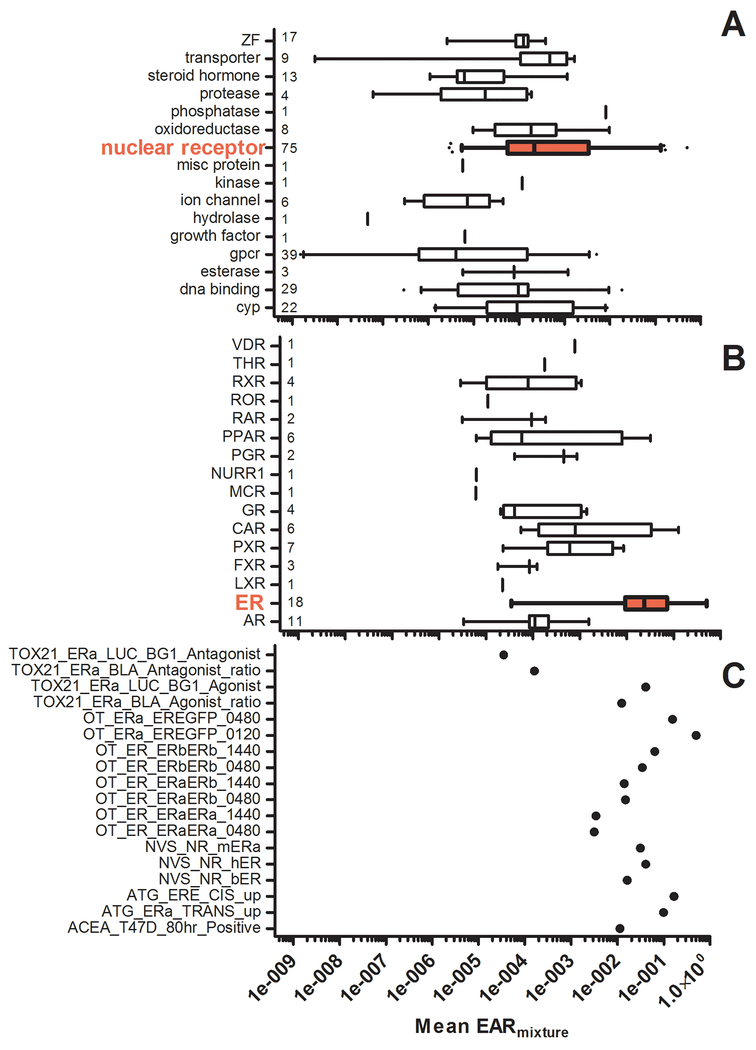
Figure 3.
A) Mean EARmixture values within each assay category as defined by the ‘intended_target_family’ annotation field (see SI Table S2). The number in each row is the number of assays in a category. B) Mean EARmixture values within the ‘nuclear receptor’ assay category as defined by the ‘intended_target_gene_symbol’ annotation field (see SI Table S2). The number in each row is the number of assays in a category. C) Mean EARmixture values for individual assays under the ‘ESR’ category.

