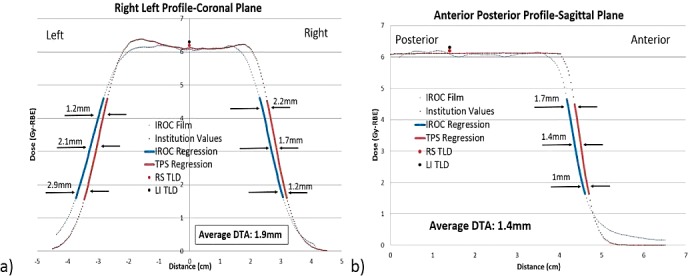
Figure 4.

(a) Right-left and (b) anterior-posterior profiles from scattered beam delivery analysis. Images show film measurement and institution calculated results, with emphasis on the distance-to-agreement analysis that was conducted by averaging the agreement at the 75%, 50%, and 25% isodose lines.
