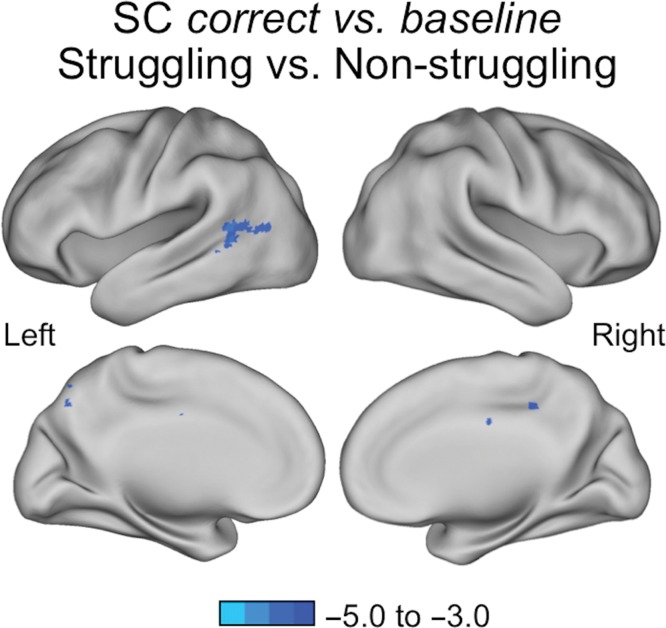
Figure 3.
Group comparison for SC task correct versus baseline. Z-score thresholds represented by the colored bars. Zs > 3.1, Ps < 0.05, corrected for multiple comparisons. Brain areas showing less positive BOLD activation in struggling readers (N = 60) relative to nonstruggling readers (N = 32) in the left posterior temporal cortex (MNI coordinates: −60, −58, +6).

