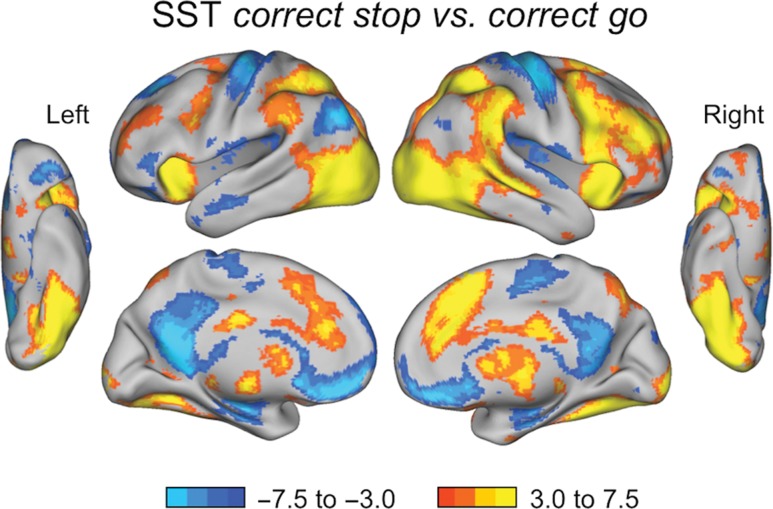
Figure 4.
SST whole brain results for all participants (N = 99). Zs > 3.1, Ps < 0.05, corrected for multiple comparisons. Brain areas showing the correct stop versus correct go contrast, with more positive activation for correct “Stop” trials in yellow/orange and more positive (or less negative) activation for correct “Go” trials in blue.

