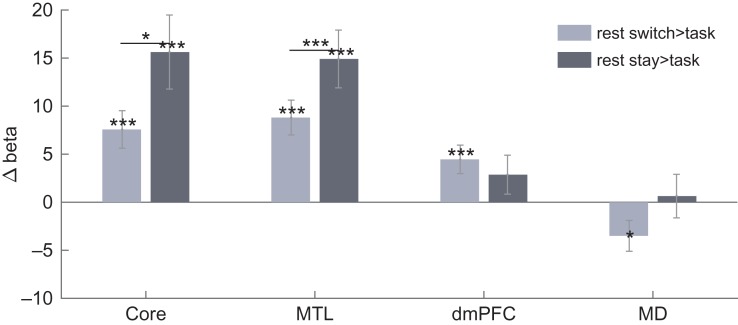
Figure 3.
Contrasts of rest compared with task activity in each DMN subnetwork and the MD network. Significant (P < 0.05) increases in rest activity compared with task, as well as paired t-tests between contrasts within DMN subnetworks, are indicated with *P < 0.05, **P < 0.02, ***P < 0.01. Error bars show standard error of the mean across participants.

