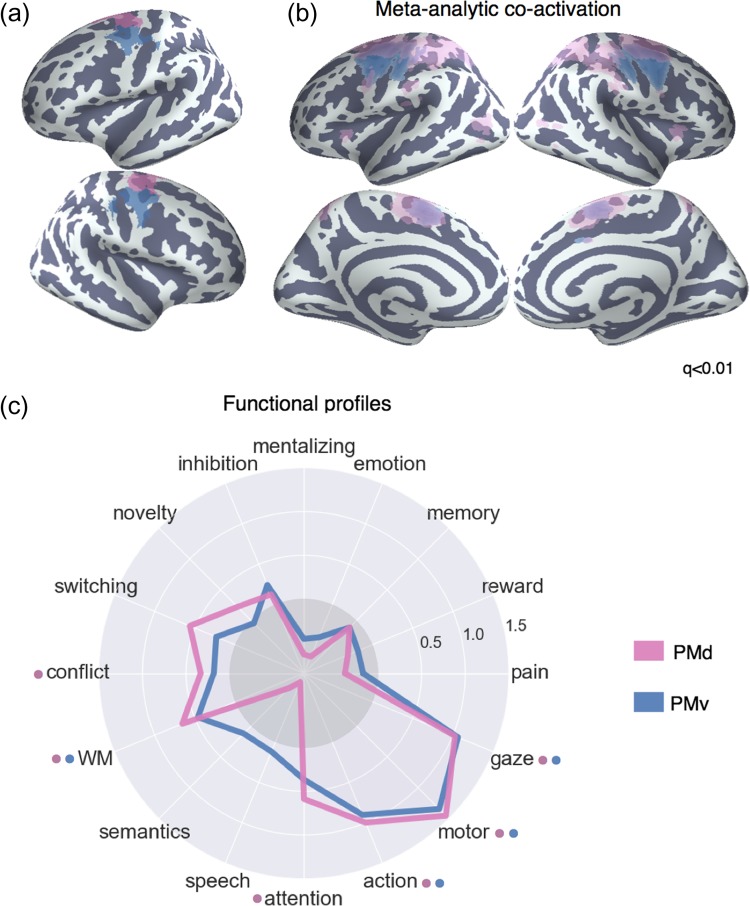
Figure 6.
Meta-analysis of somatosensory clusters. (a) Clusters projected onto an inflated surface. (b) Differences in co-activation between each cluster and the rest of LFC. Colored voxels activated more frequently in studies in which the seed cluster of the same color was also active. (c) Functional preference profiles reveal distinct psychological signatures. Strength of association is measured in LOR, and permutation-based significance (q < 0.05) is indicated next to each topic by color-coded dots corresponding to each cluster. Negative associations are indicated by the gray circle.

