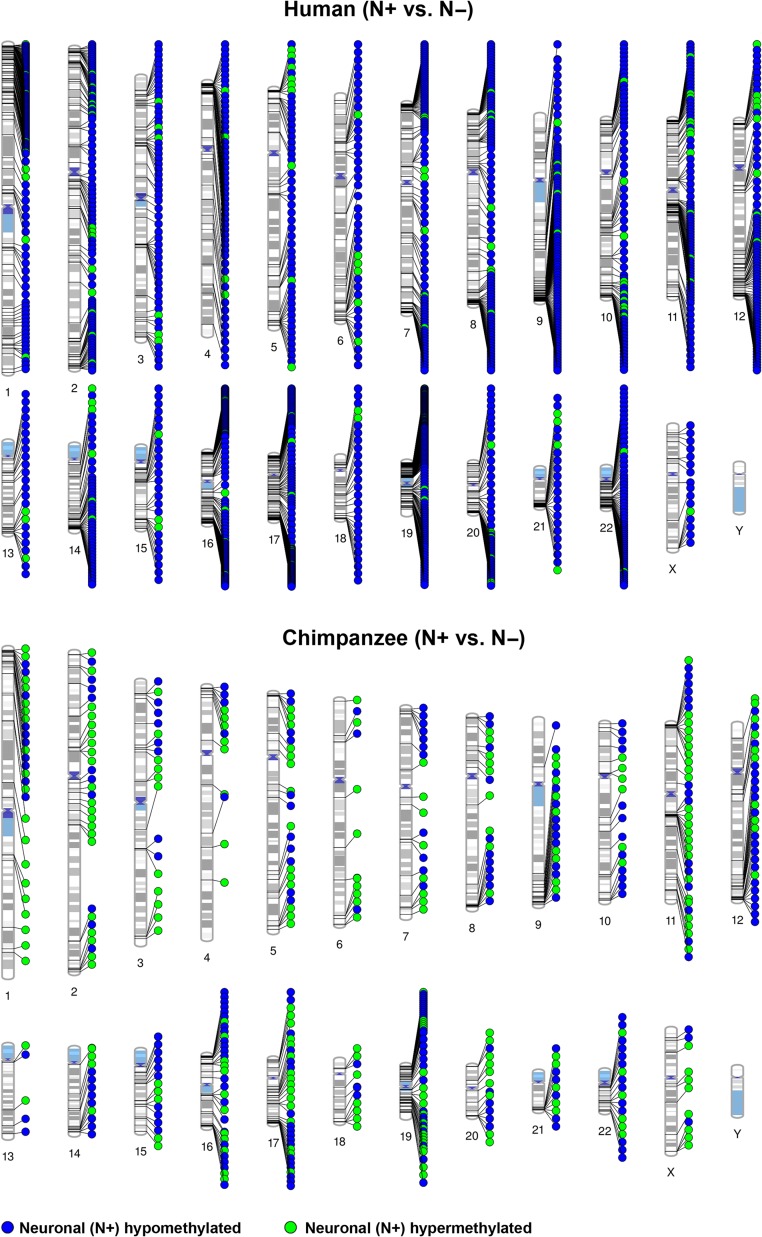
Figure 1.
Chromosomal distribution of intraspecific DMRs between neuronal (N+) and non-neuronal (N−) cells. The upper diagram shows human and the bottom diagram chimpanzee DMRs (mapped on the human karyotype). Blue dots represent DMRs that are hypomethylated, green dots DMRs that are hypermethylated in neuronal cells.

