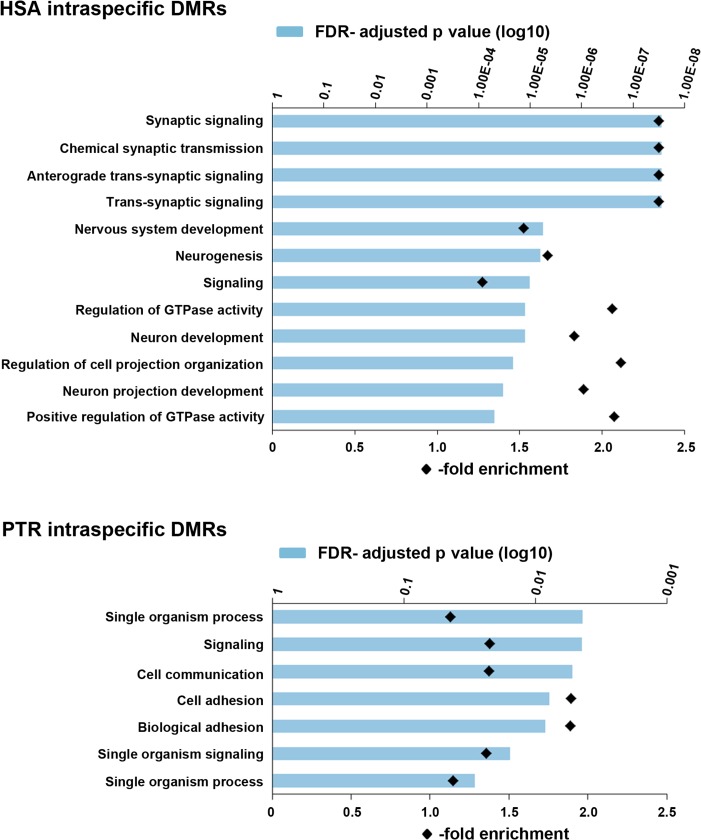
Figure 3.
Enrichment of GO terms for biological processes in genes with intraspecific DMRs (N+ vs. N− cells). The blue bars indicate the FDR-adjusted P value for enrichment of a given term (on the Y-axis). Black diamonds indicate the degree of enrichment (fold overrepresentation). The upper diagram shows the top 12 (of 52) terms in human intraspecific DMRs, the bottom the 7 significant terms in chimpanzee intraspecific DMRs.

