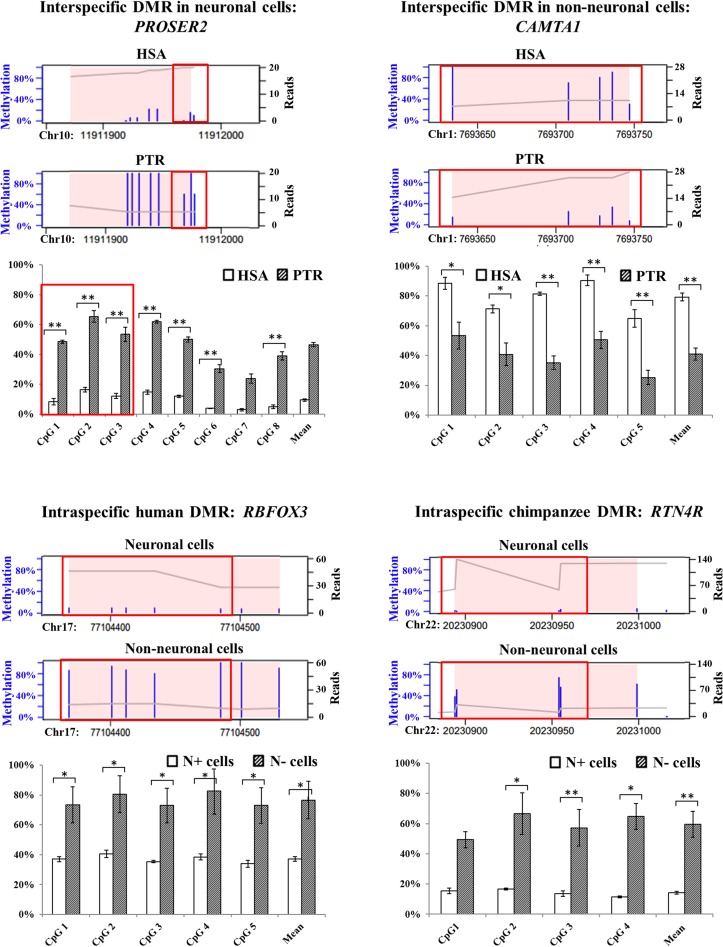
Figure 4.
Comparison of RRBS and bisulfite pyrosequencing results for PROSER2 (interspecific neuronal DMR), CAMTA1 (interspecific non-neuronal DMR), RBFOX3 (intraspecific human DMR), and RTN4R (intraspecific chimpanzee DMR). Thin blue bars in the RRBS plots indicate the methylation levels (0–100%) of single CpGs. The X-axis indicates the genomic position of the identified DMR, which is highlighted by a pink background. The gray line represents the sequence coverage (number of reads for each nucleotide). The bar diagrams below the RRBS plots indicate the single CpG methylation levels of a given region measured by bisulfite pyrosequencing. Significance levels for an inter- or intraspecific methylation difference are indicated by one star (P < 0.05) and two stars (P < 0.01), respectively. Identical CpGs in the RRBS and bisulfite pyrosequencing data are framed in red.

