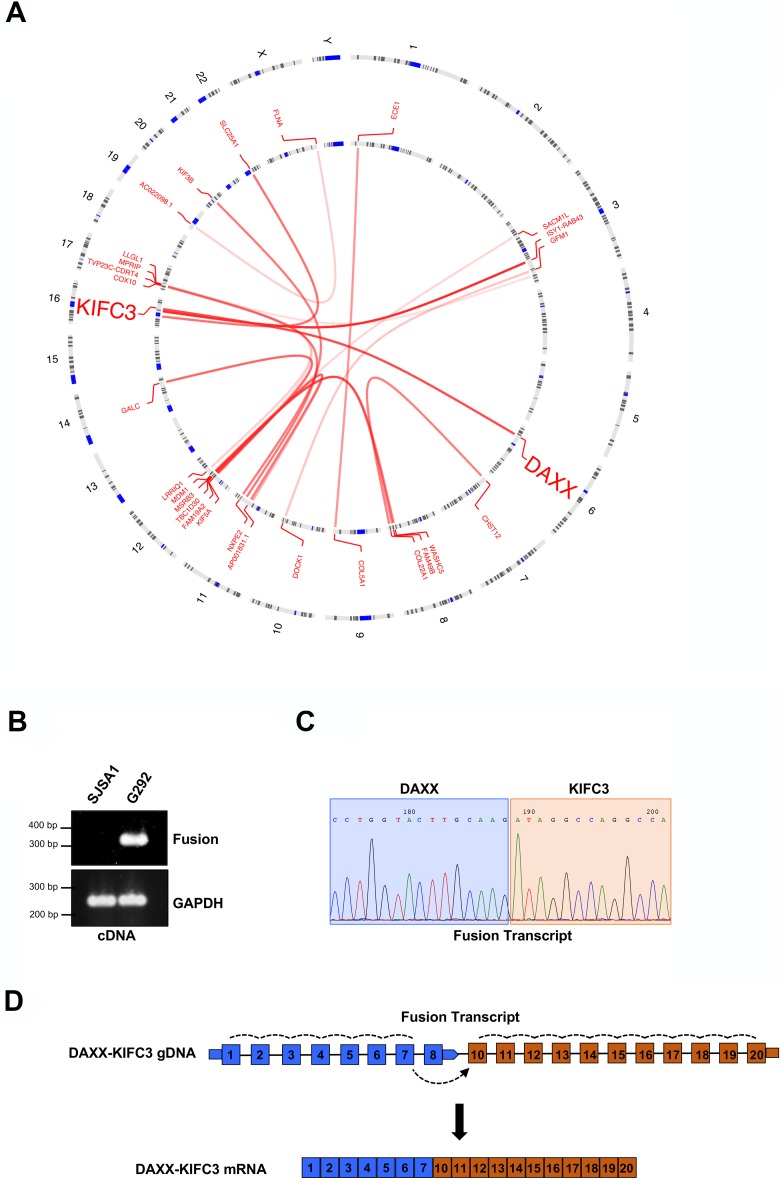
Figure 1. Identification of a DAXX-KIFC3 fusion transcript in an ALT positive osteosarcoma.
(A) Circos plot generated using the OmicCircos package following RNA sequencing of the G292 cell line. Lines represent the predicted interchromosomal fusion transcripts. (B) RT-PCR amplification products from SJSA1 and G292 RNA using primers that either flank the predicted transcriptional fusion site or amplify GAPDH as a control. (C) Representative chromatogram of the Sanger sequencing results from the RT-PCR product generated from G292 RNA. Sequence shown highlights the region where the fusion event between DAXX and KIFC3 occurs. (D) Schematic of the fusion transcript that contains exons 1–7 of DAXX and exons 10–20 of KIFC3. Dotted lines indicate splicing events.

