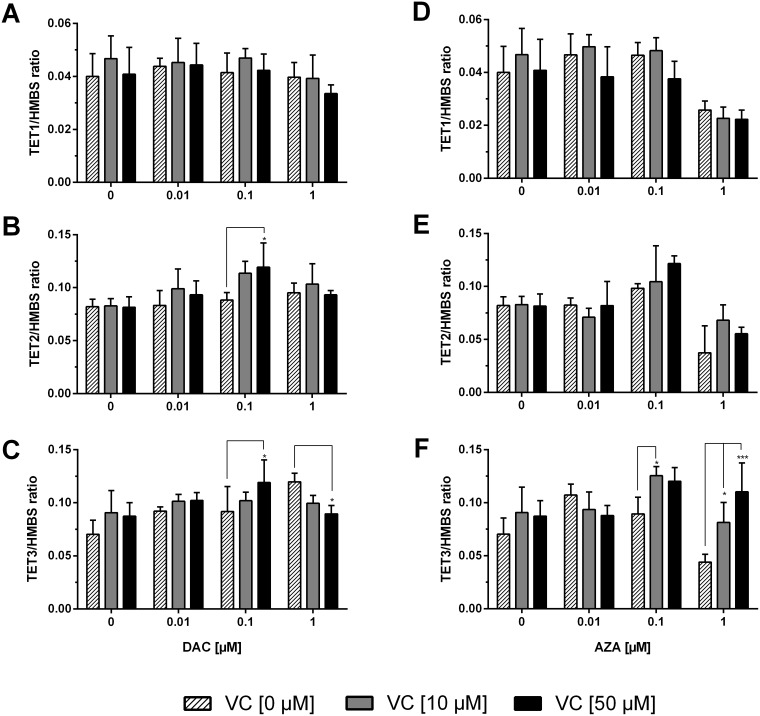
Figure 6. Expression profile of TET dioxygenases in human colon cancer cells.
The mRNA levels of TETs were determined after 72 h treatment with increasing concentrations of DAC (A, B, C), AZA (D, E, F) in combination with or without vitamin C (0, 10 and 50 μM). The relative quantification was calculated by 2-ΔΔCT method. HMBS served as control. Statistical significance was calculated using 2-way ANOVA and Tukey post-test: *p < 0.05, **p < 0.01, *** < 0.001. Error bars = SD; n=3.

